
Power BI Certified
Smart Matrix
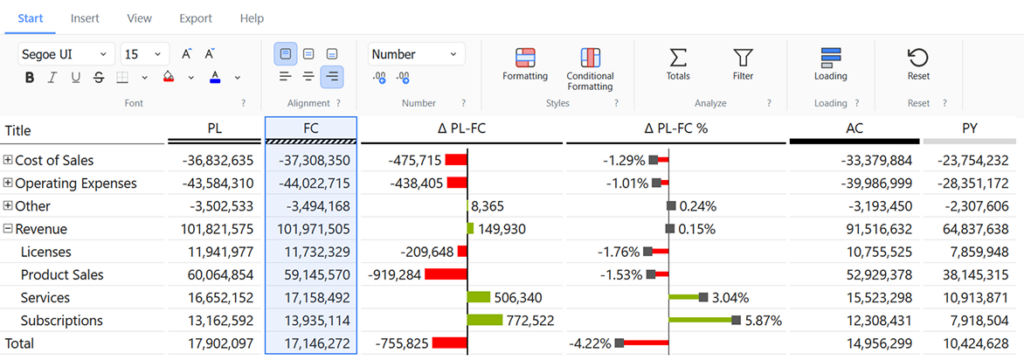
Smart Matrix is a matrix visual for Power BI. It shows a hierarchy of rows against groups of columns, like the standard matrix – and lets you format it the way you format a spreadsheet: with a ribbon of buttons, a formatting panel, conditional formatting rules and ready-made looks.
key features
Excel-style formatting, Power BI-scale data.
1
Format like in Excel
Select a row, a column, a header or single cells and style them from a ribbon you already know: font, fill, borders, alignment and number formats. Every change is listed in the Formatting panel and can be undone with Undo / Redo.
2
Conditional formatting
Highlight what matters by value — with rule-based conditions, data bars and color scales. Outliers and risks stand out before anyone has to read a number.
3
Charts in cells
Turn any measure column into a bar, waterfall or needle chart. See trends and deviations right next to the figures, without leaving the matrix.
4
Built for deep hierarchies
Open rows with + / −, jump the whole table to a level with Layer Toggles, or use Power BI’s own drill buttons. On-Demand Loading fetches children only when needed; Full Loading delivers the whole hierarchy up front. Very large tables stream in while you already work with them.
5
Financial Headers
Mark Actual, Plan and Forecast with the IBCS-like standard marker under each measure header, so management reports read the same way across your organization.
6
Templates & layout
Change the whole look in one click with ready-made templates, then fine-tune spacing, lines, row banding and outline.
7
Export & share
Export the table to Excel or PDF, or copy single cells, rows or columns to the clipboard. Copy Settings carries your formatting to another Smart Matrix.
Getting started
Three fields. Then format right in the visual.
Add Smart Matrix like any other Power BI visual, fill three field wells — and do all formatting inside the visual in Focus Mode, not in the Format pane.
01
Rows
02
Columns
03
Values
free to try, licensed to scale
Test the real visual before you buy it.
free
Evaluate
Download from Microsoft AppSource and try Smart Matrix on your own dashboard. Core functionality is available; a watermark and data limits apply.
AppSource Plan
Subscribe
Purchase a plan on AppSource and assign licenses to users via the Microsoft 365 Admin Center. Restrictions lift for licensed users.
Custom License
Enterprise
related visuals
Pair it with the rest of the set.
Process Gantt
Visualize process data and timelines with up to millisecond accuracy.
