
Power bi visuals
Visuals built for effective reporting needs.
Each one is Power BI certified, actively maintained, and used in production by hundreds of teams — built to answer questions native Power BI visuals can’t.
Power bi Visuals

Process Flow
PBI certified
Transforms event logs into interactive flow graphs with automatic variant detection and golden-path highlighting. Lead times, bottleneck counts, and deviation rates — visible in seconds.

Process Gantt
PBI certified
Visualizes process data, tickets, tasks, project phases and timelines with up to millisecond accuracy — so bottlenecks are easy to pinpoint.

Data Slicer
PBI certified
Efficiently filters your data across every visual in your report — bulk-insert up to 30,000 values and filter with a click.

Dynamic Icon
PBI certified
1,500+ data-driven icons that change automatically based on the measures or thresholds you define — no manual updates required.

Landing Page
PBI certified
A centralized hub for your entire Power BI ecosystem — one command center for every report, dataset, dashboard, and app.

Smart Table
PBI certified
A high-performance, IBCS-compliant table visual with built-in microcharts and pixel-perfect rendering for corporate reporting.
at a glance
Which visual fits your question?
| Visual | Best for | Typical question it answers |
|---|---|---|
| Process Flow | Process mining, variant analysis | “What path do most cases actually take — and where do they deviate?” |
| Process Gantt | Timing & clustering analysis | “When do delays happen, and do they cluster around a day or shift?” |
| Data Slicer | Self-service filtering & copy-paste mechanism | “Can I see this broken down by team without asking BI to rebuild it?” |
| Dynamic Icon | At-a-glance status / KPI | “Are we currently on track, or is something already slipping?” |
| Landing Page | Power BI tenant navigation | “Where do I even find the report I’m looking for?” |
| Smart Table | IBCS-compliant financial reporting | “Can our management report look consistent and professional, every time?” |
Haven't found a visual for your needs?
If you need specially crafted visual for your special need, we also offer custom visual development.
microstrategy Visuals
Flow
Flow chart visualizing process data, tickets, tasks and variants with up to millisecond accuracy.

Gantt
Process data, tickets, tasks, project phases and timelines with up to millisecond accuracy.

Fuel
IBCS-conform fuel-gauge chart with flexible scaling and a traffic-light performance indicator.

Graph
IBCS-compliant bar chart with supplementary deviation/waterfall overlays, a rest bar, and a total bar.
Stacked
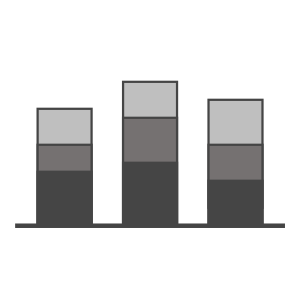
IBCS-compliant stacked bar chart — combine stacked and normal bars, with built-in deviation calculation.

Table
IBCS-compliant table with up to five grouped sections, microcharts, and threshold-based color coding.

Text
A rich text editor with HTML support, custom syntax, and dynamic content from data attributes.

Waterfall
IBCS-compliant waterfall chart with flexible orientation, target values, and best/worst-case lines.
Not sure which visual you need?
Tell us what your report is missing — we’ll point you to the right visual
