
Power BI Certified
Process Gantt
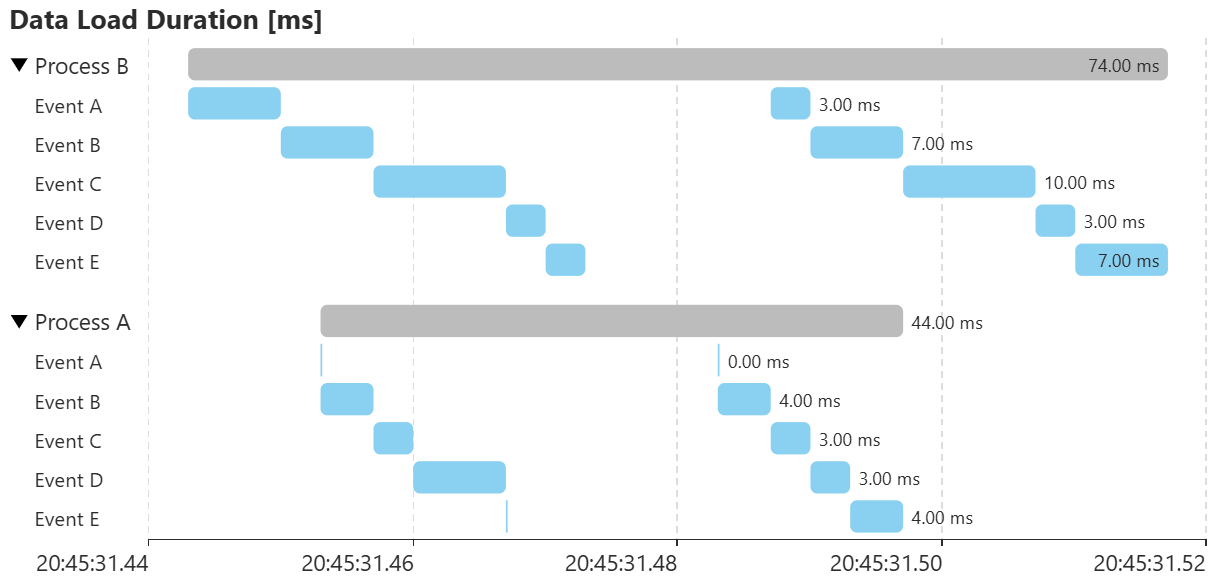
Visualize process data, tickets, tasks, project phases and timelines with up to millisecond accuracy. A clear representation of every process sequence, showing the start and end of each activity so bottlenecks are easy to pinpoint.
key features
From raw timestamps to a readable timeline.
1
Millisecond-accurate timelines
2
Parent categories & hierarchy
3
Extensive configuration
4
Individual formatting
Style past, active, and future events independently — completion colors, highlighted ongoing activity, and planned-task styling, all at a glance.
Getting started
Five fields. One readable timeline.
01
Category
02
Parent Category
03
Start time
The start timestamps for each task or event, giving a clear timeline with up to millisecond accuracy.
04
End time
The end timestamps for each task or event, giving a clear timeline with up to millisecond accuracy.
05
Tooltips (optional)
Try it yourself
Try Process Gantt
introduction video
also included
Built for daily use, not just demos.
- Representation of process flows
- Current timestamp to clearly display process status
- Integrated Power BI menu for customization
- Legend for a better overview of processes
- Grid for more structure
- Interaction with other graphs on the report
- Filtering by clicking events, parent categories, or categories
related visuals
Pair it with the rest of the set.
Process Flow
free to try, licensed to scale
Test the real visual before you buy it.
free
Evaluate
Download from Microsoft AppSource and try Process Gantt on your own dashboard. Core functionality is available; a watermark and data limits apply.
AppSource Plan
Subscribe
Purchase a plan on AppSource and assign licenses to users via the Microsoft 365 Admin Center. Restrictions lift for licensed users.
Custom License
Enterprise
See Process Gantt on your own data.
Try it now, or talk to us about the delays your averages are hiding.
