
Power BI Certified
Smart Table
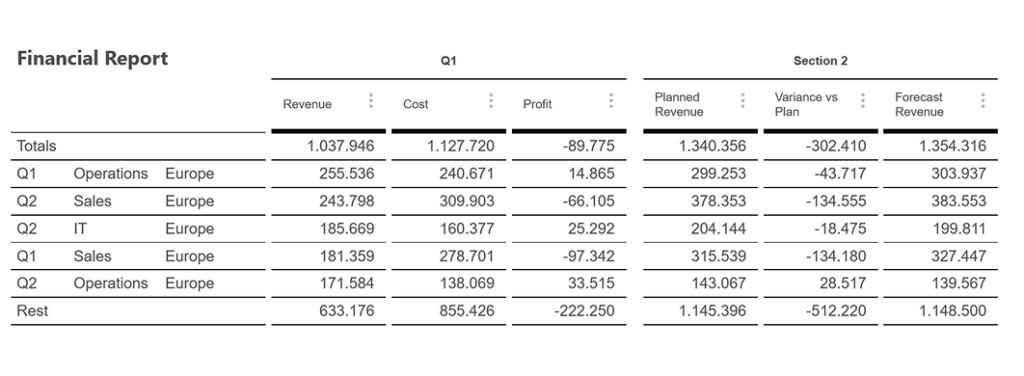
Visualizing financial data like income statements in an IBCS-compliant table for Power BI. Standardize your business communication with built-in IBCS compliance and turn static tables into dynamic dashboards. Business communication or financial reporting, several sections can visualize different perspectives in one table.
key features
Built for high-stakes corporate reporting.
1
Pixel-perfect rendering
Every cell, line, and chart is aligned with absolute accuracy — keeping financial statements crisp and trustworthy, no matter how complex the layout. Pixel perfect rendering, enabling print-ready output
2
Intelligent name detection
Instantly identifies data columns based on their names and applies the matching standardized IBCS style — no manual mapping required.
3
Microcharts
Embed bar charts and deviation indicators — absolute and relative — directly into your rows. Spot trends, outliers, and performance gaps without leaving the table view.
4
Flexible hierarchies
Multi-level grouping with “Top-N” and “Rest” row aggregation, so long lists collapse into the categories that actually matter.
5
Advanced calculation engine
Go beyond standard totals with Average, Minimum, Maximum, and custom formula-based totals — like Metric A divided by Metric B.
6
Multi-section organization
Group your metrics into up to five distinct sections, each with independent headers, borders, and formatting rules.
7
Custom colors
A comprehensive color management system: curated palettes to match your corporate identity, or data-driven coloring to flag risks and organize complex hierarchies.
8
IBCS compliance
Automatically detects data categories like Actual (AC), Plan (PL), Previous Year (PY), and Forecast (FC), applying the standardized IBCS visual language throughout — no guesswork in financial reporting.
9
Row/Column based thresholds
Custom row and column based thresholds, defined by a user-specific column.
Getting started
Rows, plus up to five sections.
Structure your table the way your management report actually reads — not the way a default Power BI table forces it to.
01
Rows
02
Section header & values (×5)
Try it yourself
Try Smart Table
introduction video
Coming Soon
free to try, licensed to scale
Test the real visual before you buy it.
free
Evaluate
Download from Microsoft AppSource and try Smart Table on your own dashboard. Core functionality is available; a watermark and data limits apply.
AppSource Plan
Subscribe
Purchase a plan on AppSource and assign licenses to users via the Microsoft 365 Admin Center. Restrictions lift for licensed users.
Custom License
Enterprise
related visuals
Pair it with the rest of the set.
Process Gantt
Visualize process data and timelines with up to millisecond accuracy.
