
Power BI Certified
Landing Page
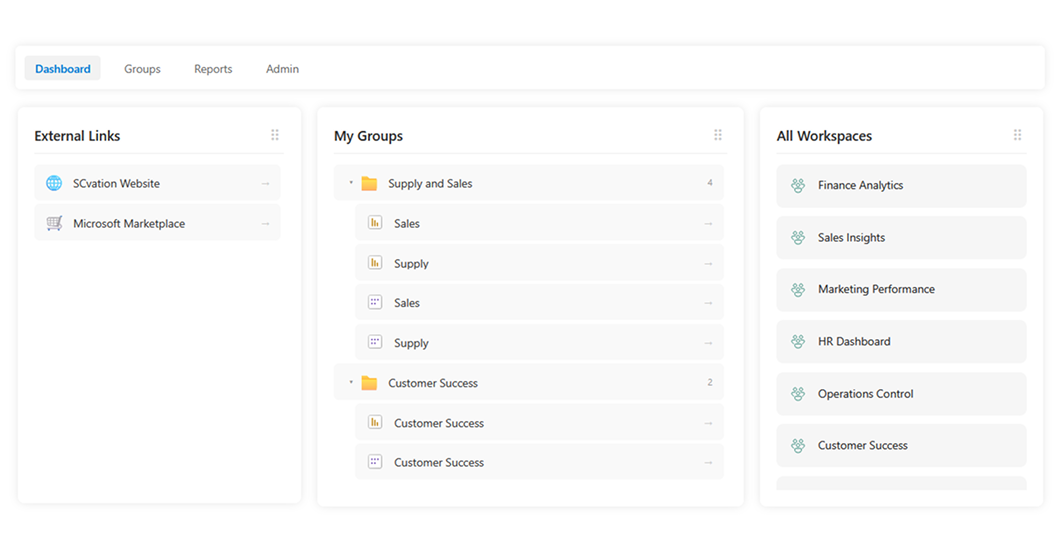
Create a centralized hub for your entire Power BI ecosystem. Instead of jumping between workspaces, Landing Page gives users a streamlined “command center” to access every report, dataset, dashboard, and app from one unified interface.
KEY benefits
Stop making people hunt for the right report.
Unified tenant overview
Every Power BI asset — workspaces, reports, dashboards, apps — in one structured view, eliminating constant browser navigation.
Custom logical grouping
Break free from workspace silos. Bundle related reports and datasets into your own groups, regardless of where they live in the service.
Integrated custom links
Four Views
One entry point for your whole Power BI tenant.
1
Dashboard
A customizable entry point for every user — a high-level overview through interactive widgets. Access Favorites, External Links, and summaries of Groups and Workspaces. Admins get a drag-and-drop layout editor.
2
Groups
Organizes reports and dashboards into logical business categories — departments, projects, functional areas. Users browse curated collections instead of searching through hundreds of files.
3
Reports
A complete, explorer-style inventory of every Power BI asset you have access to, mirroring the familiar workspace hierarchy — with built-in search and filtering across your entire organization.
4
Admin
Exclusive to authorized users: manage permissions, define groups, set up global external links, and oversee layout and default configuration for the whole visual.
Getting started
Point it at your own asset inventory.
Landing Page reads a dataset describing your Power BI tenant — typically exported once and refreshed on a schedule.
01
Workspace id, name & URL
Identifies each workspace and links directly to it.
02
Asset id, name & type
Important notice
How it works
Collect and store your Power BI tenant data in a database or Excel using the Power BI REST API. Visualize these data points directly in a Power BI report landing page so you always stay in control of your data. Reach out to SCvation if you need support.
Try it yourself
Try Landing Page
introduction video
free to try, licensed to scale
Test the real visual before you buy it.
free
Evaluate
Download from Microsoft AppSource and try Landing Page on your own dashboard. Core functionality is available; a watermark and data limits apply.
AppSource Plan
Subscribe
Purchase a plan on AppSource and assign licenses to users via the Microsoft 365 Admin Center. Restrictions lift for licensed users.
Custom License
Enterprise
related visuals
Pair it with the rest of the set.
Process Flow
See the path your process actually takes, with automatic variant detection.
Process Gantt
Visualize process data and timelines with up to millisecond accuracy.
