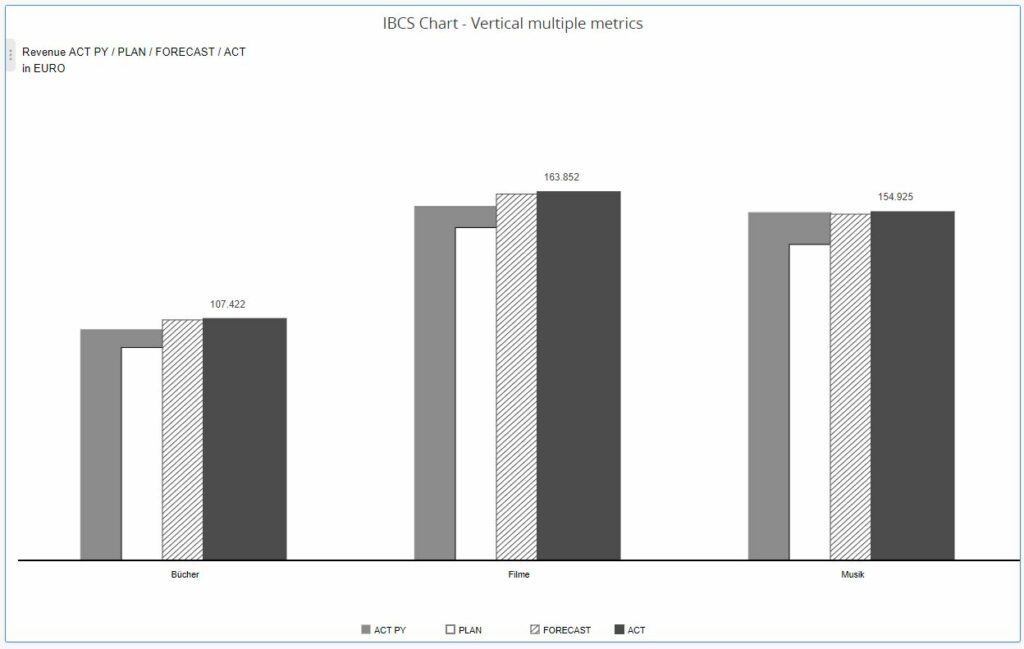
The Graph visual ensures data consistency and clarity by following IBCS standards. It allows the addition of supplementary charts, like deviation and waterfall charts, for a deeper understanding of data trends. Features such as a “rest bar” consolidate minor values to maintain readability, while a “Total bar” provides an easy overview of total data. With extensive customization options, you can tailor the visual to meet both aesthetic and functional needs.
The bars in the Graph visual can be formatted to adhere to the International Business Communication Standards (IBCS), which aim to enhance clarity and consistency in business reporting. This format standardizes the presentation of data, ensuring that similar data types are represented consistently across reports. It emphasizes clear labeling, uniform use of colors and symbols, and structured layouts to make data easily understandable and comparable.
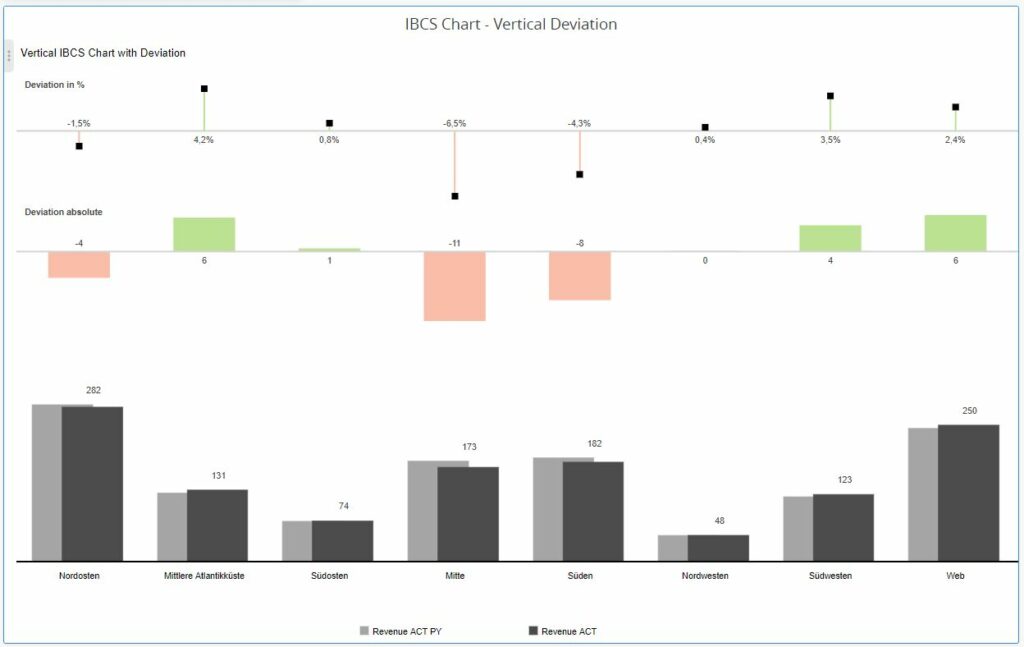
Supplementary Charts
The Graph visual supports the addition of supplementary charts, such as absolute/relative deviation charts or waterfall charts, on top of the bar chart. This feature enhances data analysis by providing a more comprehensive view of variations and trends, making it easier to understand and compare different data sets.
Documentation button
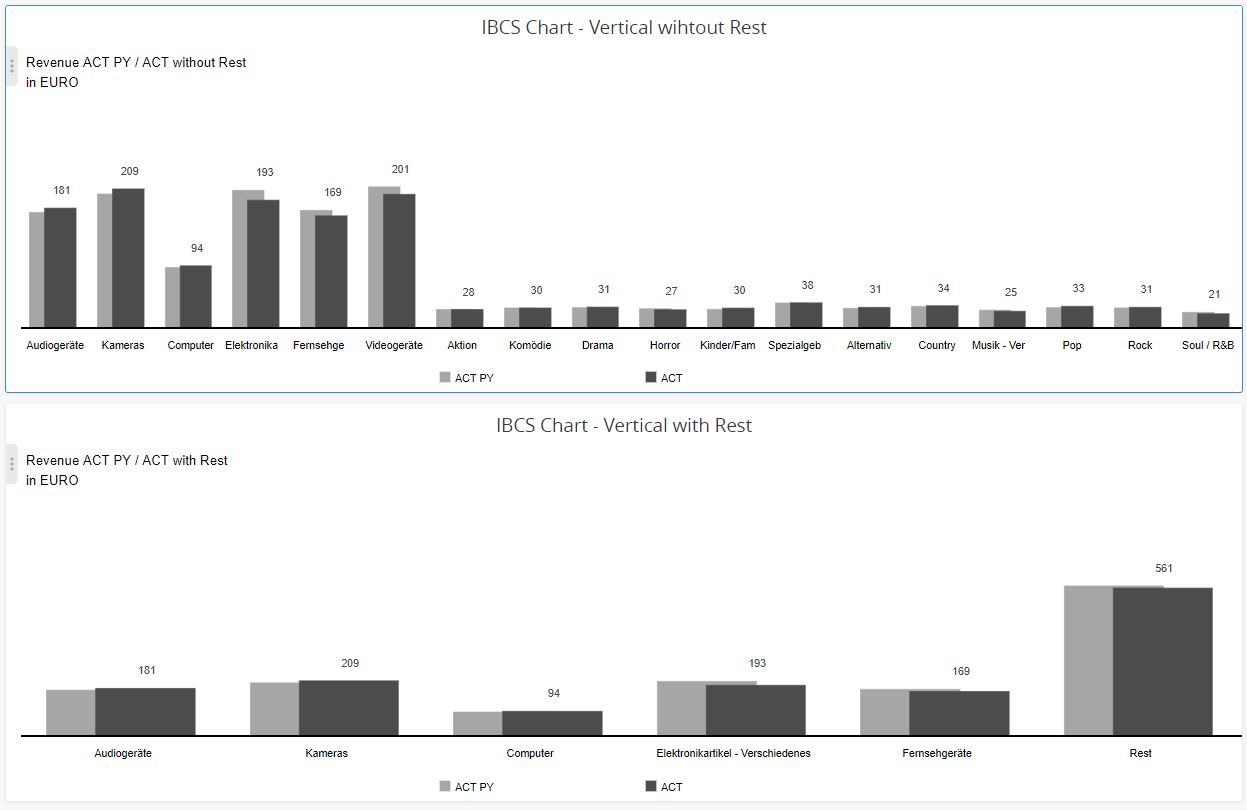
Rest Bar
The Graph visual includes an option to display a “rest bar” that summarizes the remaining values when the number of bars exceeds a certain threshold. This feature helps maintain clarity and readability by consolidating less significant data into a single bar, ensuring the chart remains easy to interpret without overwhelming the viewer with too many individual bars.
Documentation button
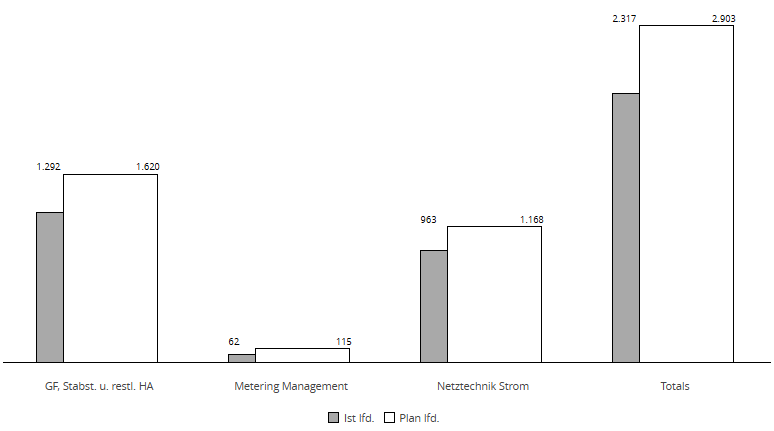
Total Bar
The user is able to enable a “Total bar” that displays the sum of all individual bars. This feature provides a quick and clear overview of the total value, making it easier to understand the overall magnitude of the data being presented.
Documentation button
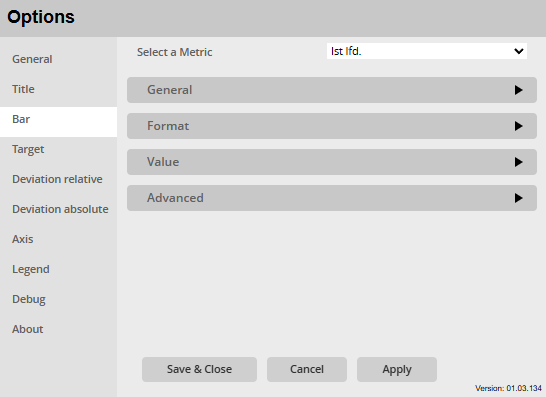
Extensive Menu
The extensive menu that allows users to fully customize both the style and function of the visualization. Users can select from a variety of colors to enhance visual appeal, and fine-tune text styles for better readability.
Beyond aesthetic adjustments, users can also configure functional aspects such as supplementary charts, show totals, only show the top 10 values an summerize the rest in one bar etc., ensuring the visualization is both informative and tailored to your specific analysis needs.
Documentation button
Additional features
IBCS conform chart
variety of diagrams
Bar Chart
Deviation absolute(Bar Chart)
Deviation relative(Needle Chart)
Waterfall (Bar Chart)
Vertical and horizontal Chart orientation
Multi Chart-View (Bar Chart, Deviation absolute, Deviation relative, Waterfall)
Every Chart-View can be used as an individual Chart.