
Power BI certified
Process Flow
See how your business actually runs.
Transform raw event logs into living, interactive process maps — revealing every path, bottleneck, and detour your data takes. No configuration. No guesswork. Microsoft code-reviewed and certified.
How it works
Three concepts.
Infinite clarity.
Your data already tells a story. Process Flow just learns to read it. Everything traces back to three building blocks.
Case
A category grouping related events — like a support ticket, an order, or a project. Everything traces back to a case.
Event
A step that happened within a case — ‘Opened’, ‘Assigned’, ‘Closed’. Events build the sequence that becomes your process graph.
Variant
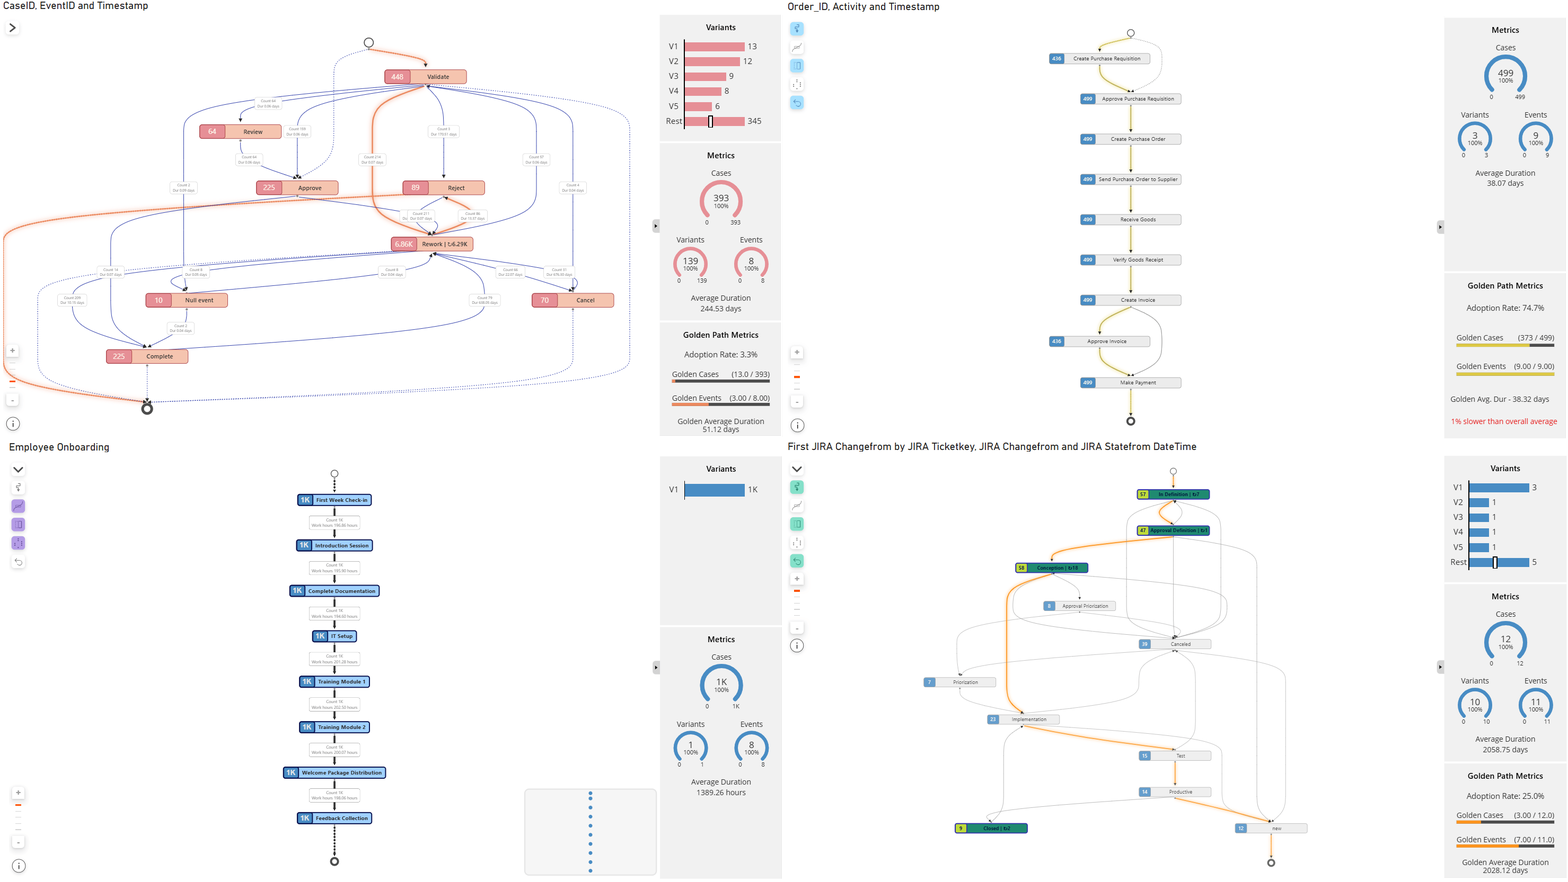
When multiple cases follow the same event sequence, they form a variant. Process Flow finds these automatically — zero configuration needed.
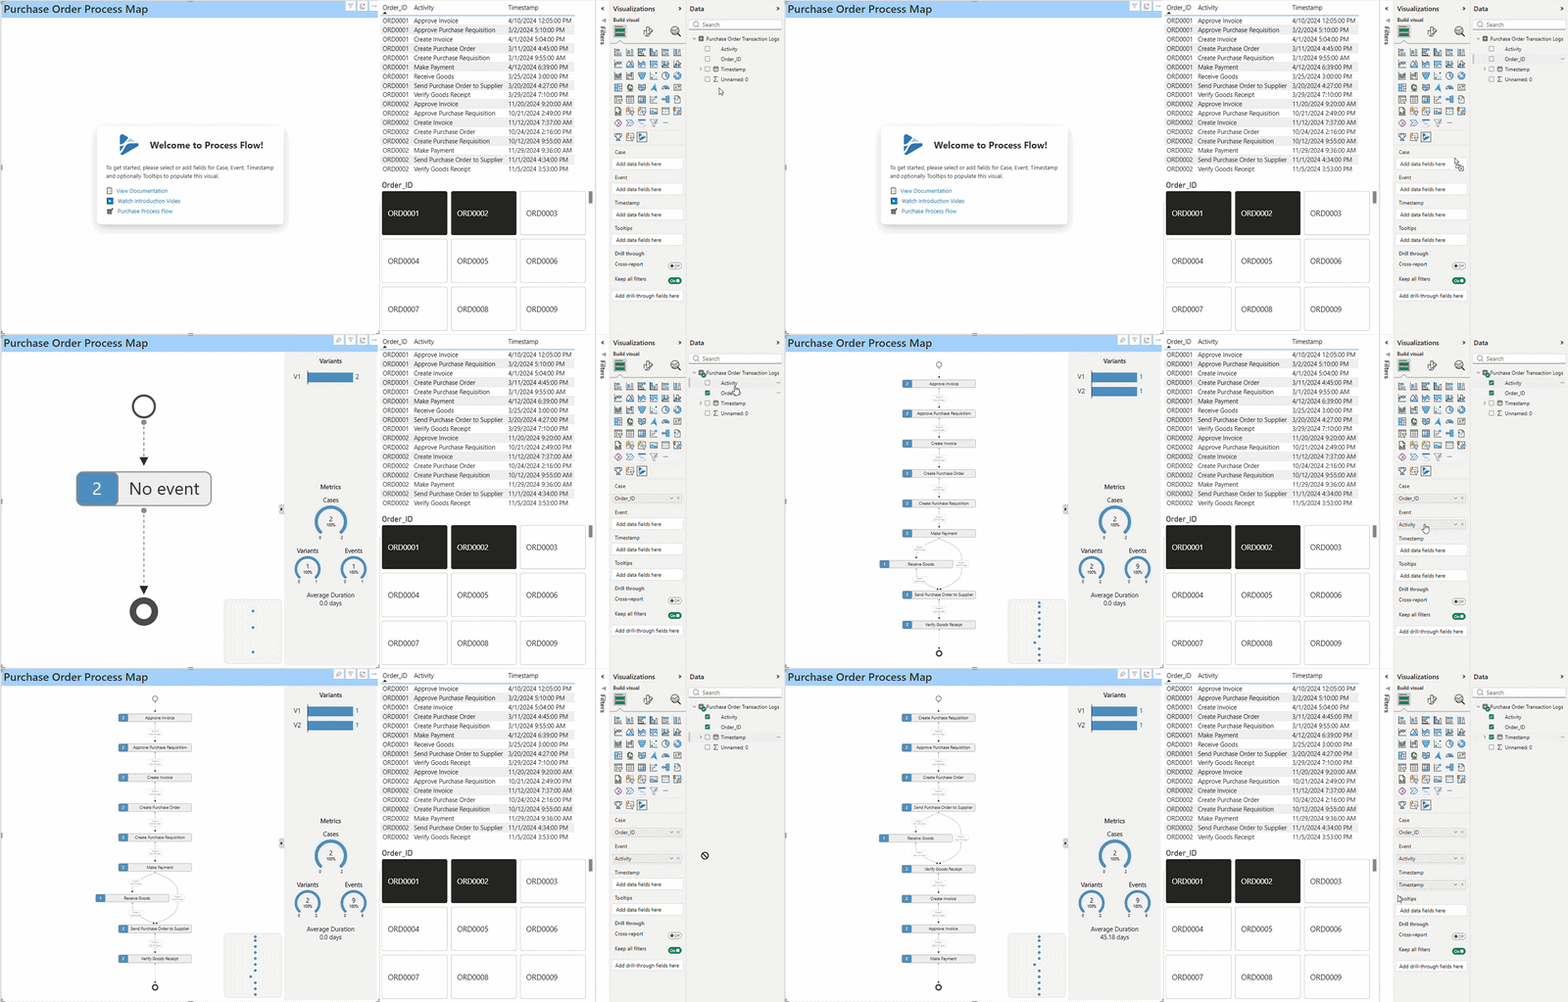
Convert jumbled transaction logs into actionable insights. Process Flow needs just three parameters to get started!
A Case ID, an Event/Activity name, and a Timestamp for every log row.
Try it yourself
Try Process Flow
Key Features
The Performance Trinity
Not just a pretty graph. Three deeply engineered capabilities that separate Process Flow from every other process visual.
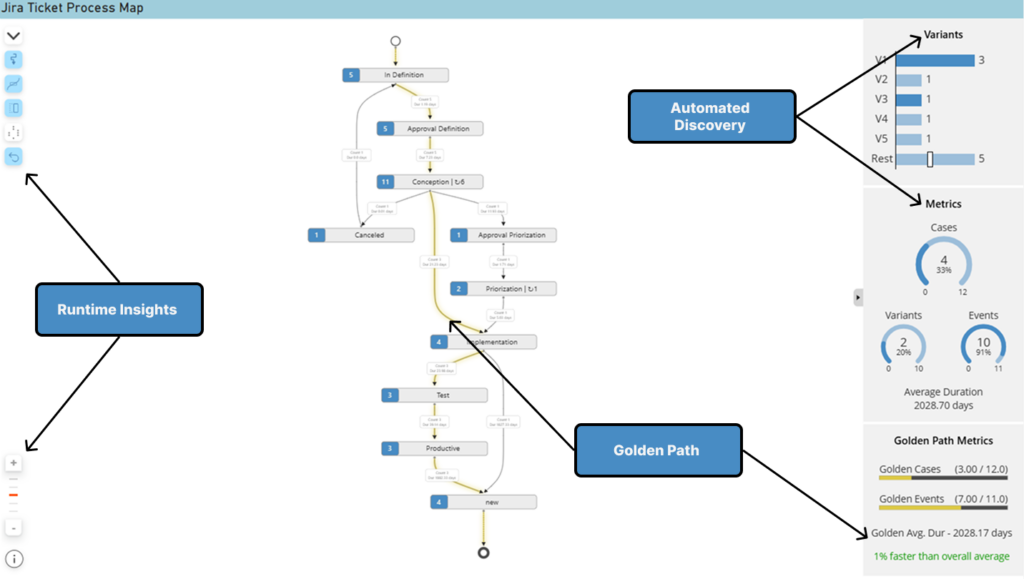
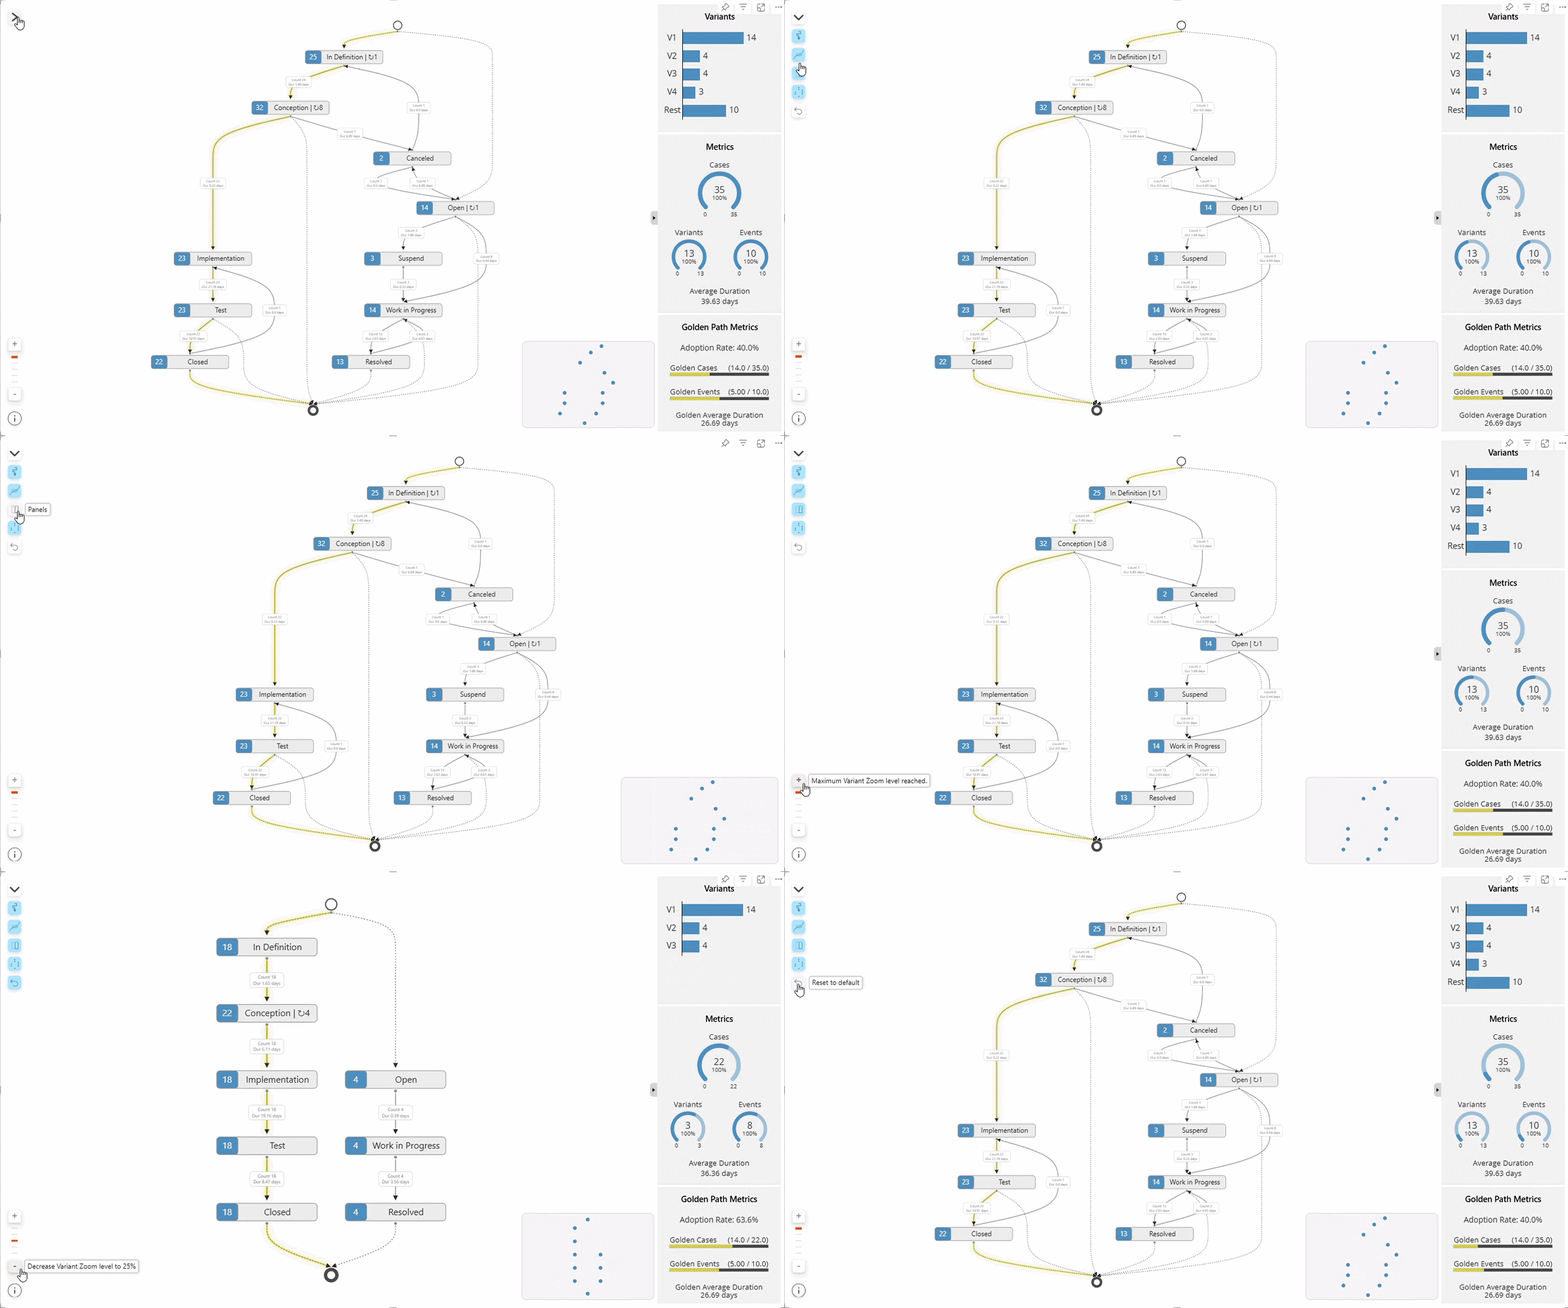
Quick menu: toggle panels, metrics, golden path live
Zoom controls for variant tuning on the fly
Info tile: row count, null subs, zoom level diagnostic
No edit access needed — all viewer-side
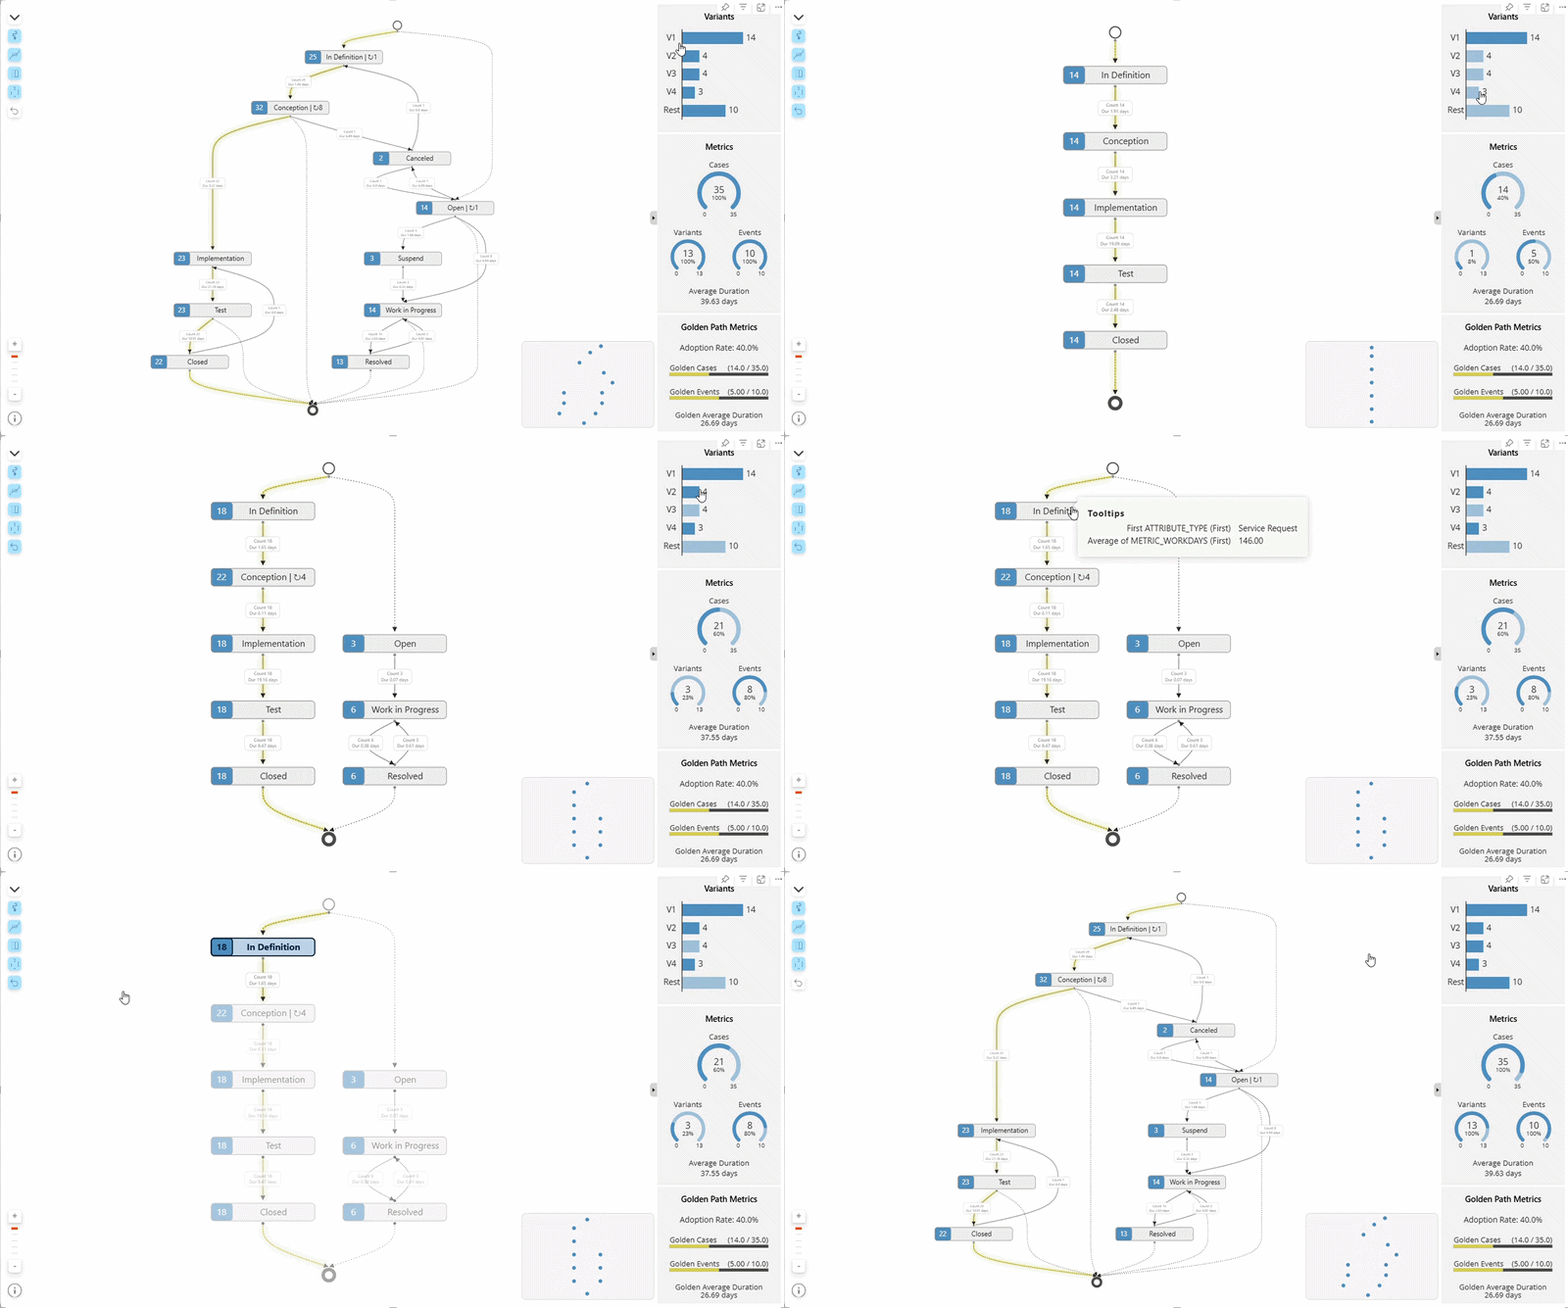
Variant computation is automatic — no setup
Interactive variant chart with bar selection
Metrics panel reflects variant selections in real time
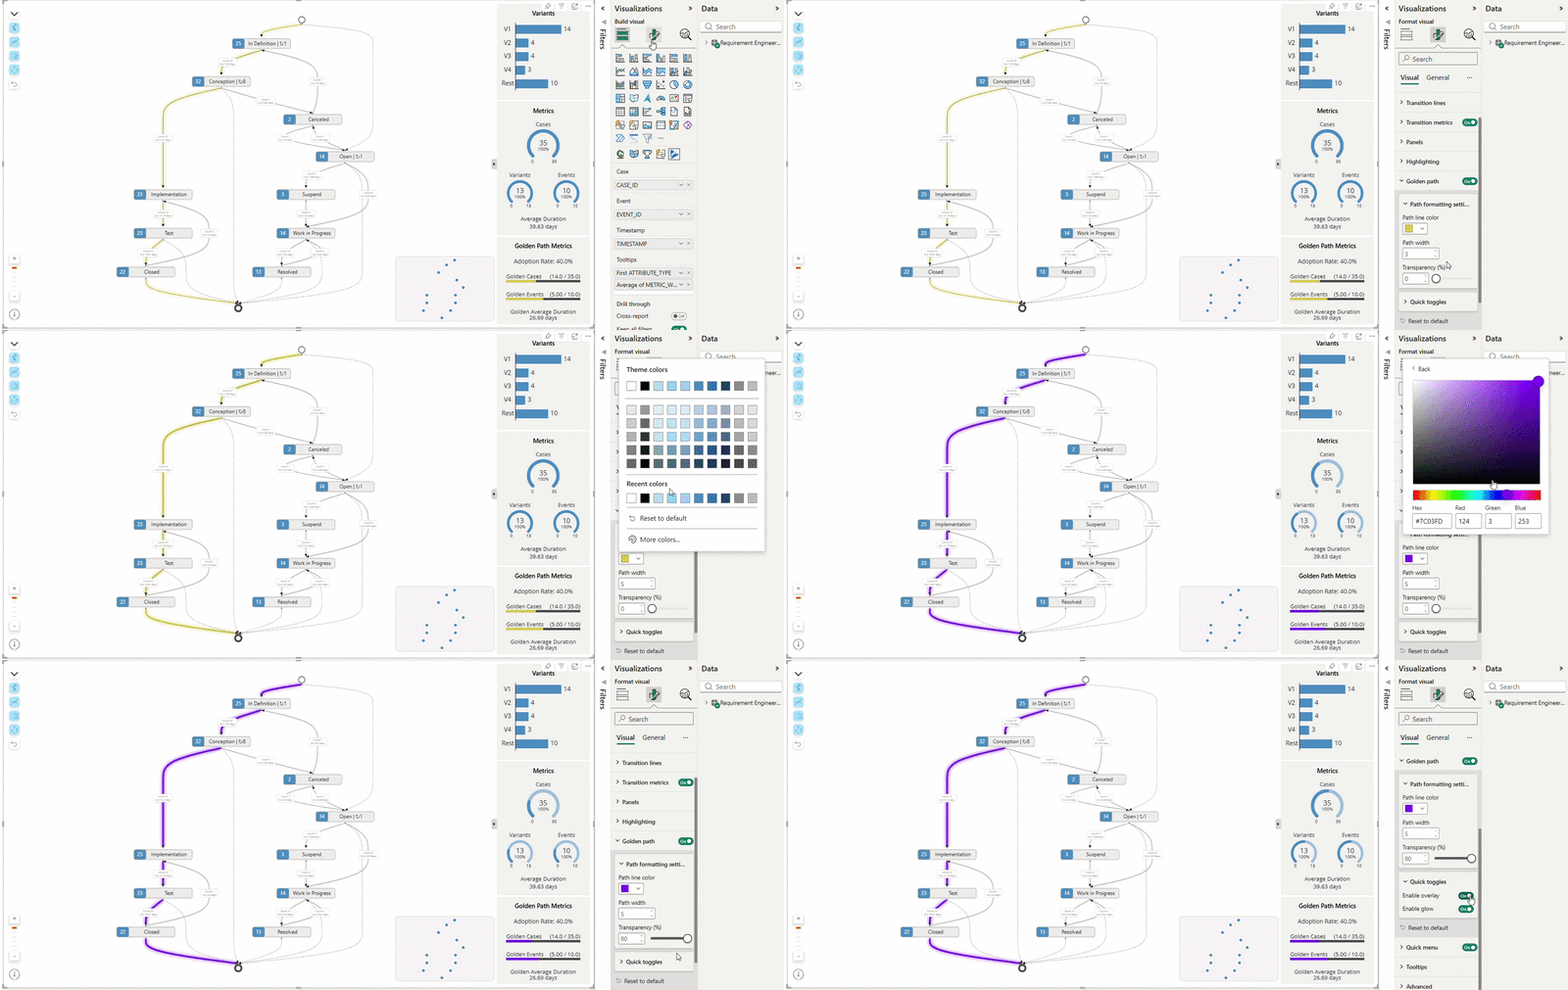
Auto-highlights the most common end-to-end route
Glow + overlay effects for sharp visual contrast
Golden Path Metrics: adoption rate and duration KPI
Color-coded faster / slower vs. overall average
See it in action
Watch. Then decide.
Two minutes is all it takes to understand why teams switch to Process Flow.
Bring your own dataset. We’ll walk through your process live and answer every question your team has.
Built for precision
The reliability details
your team will thank you for.
The features that don’t make the headline — but make the difference when it matters.
Info Tile
A hover-based diagnostic overlay showing total row count, null substitutions per field, and current zoom level. Developers love this.
Null Handling
Null Case IDs become ‘Null case’. Null Events become ‘Null event’. Null timestamps use draw time. The visual never crashes on messy data.
Power BI Certified
Microsoft-reviewed code. No external calls, no data leakage. Meets enterprise security standards right out of the box.
Customizability
Tune every layer to
your report's needs.
Every element — from box borders to tooltip aggregation — is configurable. One visual, every context.
Appearance
Colors, borders, transparency, and fonts — configurable per element. Event boxes, count boxes, transition lines, markers.
Selection Highlighting
Custom colors for selected events, counter, border, and text. Fade unselected elements to keep focus razor-sharp.
Golden Path Styling
Path color, line width, glow effect, overlay toggle — make the primary route unmissable.
Panels & Layout
Toggle the minimap, variant chart, and metrics panel on or off. Resize, reposition, recolor each independently.
Cross-filtering
Process Flow also interacts with other visualizations and can filter other PBI-native or custom visuals.
Tooltips
Per-field aggregation: SUM, AVG, MIN, MAX, First, Last. Position each tooltip individually for maximum clarity.
free to try, licensed to scale
Test the real visual before you buy it.
free
Evaluate
Download from Microsoft AppSource and try Process Flow on your own dashboard. Core functionality is available; a watermark and data limits apply.
AppSource Plan
Subscribe
Purchase a plan on AppSource and assign licenses to users via the Microsoft 365 Admin Center. Restrictions lift for licensed users.
Custom/Volume License
Enterprise
No credit card required!
A license key issued directly by SCvation, bound to the report instead of a user — every viewer gets full functionality, no exceptions.
Enterprise & Trust
Built for teams that
can't afford surprises.
Every detail of the licensing and security model was designed for organizations where failure is not an option.
Viewer-inclusive licensing
The license key is tied to the visual instance — every viewer gets full access, not just the report builder. No per-seat counting.
Offline activation
No internet connection required to validate a custom license key. Airgapped environments fully supported.
Power BI Certified
Microsoft-reviewed code with no external calls, no data leakage, and full compliance with enterprise security standards.
Have a lot of users?
Let's build something
specific for you.
Volume licensing, custom deployment, and dedicated onboarding — tailored for the scale your organization needs.
- Volume licensing with unlimited viewers
- Custom license key deployment
- Offline and airgapped activation
- Priority support and onboarding
- Custom reporting templates available
- Power BI Certified — no security exceptions needed
related visuals
Pair it with the rest of the set.
Process Gantt
Visualize process data and timelines with up to millisecond accuracy.
Uncover bottlenecks and spearhead efficiency.
Try it now, or talk to us about the metric you check most often.
