
DOCUMENTATION - MICROSTRATEGY
Administration Guide
Set Up
Installation
After the SCvation visualizations have been delivered & these are properly integrated/installed in the MicroStrategy environment.
Download SCvation visualizations
You will receive a separate zip file for each visualization.
Save the zip-files in a folder of your own and unzip them there. This will give you the following folder structure:
SCvation_Flow
SCvation_Fuel
SCvation_Gantt
SCvation_Graph
SCvation_Stacked_Graph
SCvation_Table
SCvation_Text
SCvation_Waterfall
Web/Dossier
To install the SCvation visualizations/visualization on the web/dossier, it is necessary to copy the visualizations folder to the plugins directory. This is located in the directory of the installed MicroStrategy Web/Dossier
- {MicroStrategyWebRootFolder}/plugins
- Bsp.:
- C:\Program Files (x86)\MicroStrategy\Web ASPx\plugins
The service for the web service must then be restarted and the cookies in the browser should also be emptied.
Library
To use the SCvation visualizations in the MicroStrategy Library, they must also be transferred to the associated plugins folder there. This is located in the installation directory of the library.
In addition, it should be ensured that the library is correctly linked to the web version of MicroStrategy.
- {LibraryRootFolder}/plugins
- Bsp.:
- C:\Program Files (x86)\Common Files\MicroStrategy\Tomcat\apache-tomcat-9.0.12\webapps\MicroStrategyLibrary\plugins
If there is another library server for the mobile version of the library, this should also be done again with this server.
The library service must then also be restarted and it is again recommended to empty the cookies in the browser.
PDF Export
PDF export of SCvation visualizations is supported in MicroStrategy Webs and Library. For this it must be ensured that the PDF export is correctly configured and connected to the correct web and library service.
With a MicroStrategy version of 2020 or higher, the PDF export has its own plugin directory.
If this is the case, the Scvation visualization must also be transferred to this plugins folder there.
- Windows:
- {PDFExportServiceRootFolder}/resources/plugins
- Linux:
- Default Path:
- {InstallPath}/IntelligenceServer/PDFExportService
- Installation over root
- opt/mstr/MicroStrategy/install/IngelligenceServer/PDFExportService
- Default Path:
The PDF export service must then also be restarted here.
Config
A config file (Menu-Options-File/Menu-Variables) is available for all visualizations for MicroStrategy. In these files, the default formatting and other configurations can be customized by customers to directly incorporate their own company formatting preferences.
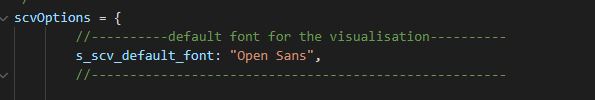
Standard font formatting
A standard font and the fonts to be selected are available in the config file for formatting the font.
The standard font is always set to “Open Sans” from the SCvation, but can be changed to the company’s standard font in the config file.
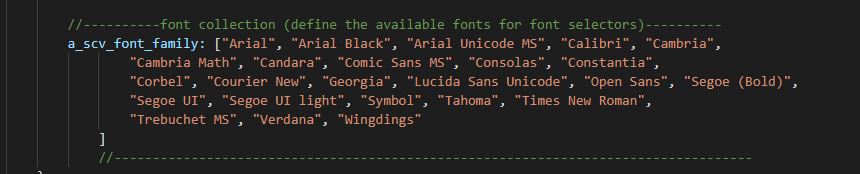
Furthermore, various texts can be formatted in the visualization, including the font of these texts. This selection uses the following array of different fonts, which can also be configured in which fonts can be removed or added to customize the SCvation visualizations for the company.
Color Config
As for the fonts, there are also ready-made color arrays for the color settings in the SCvation visualizations, which can be selected in the menu as a color palette in order to carry out different color formatting.
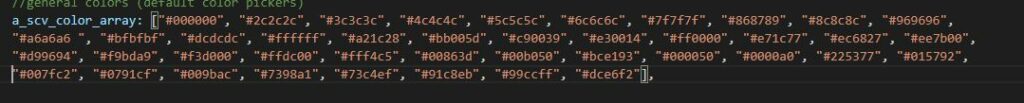
Color Array
A distinction is made between two color arrays or color palettes for the selection of the colors.
The normal color array or business color array in which various standard colors are available and all company colors can be added using hex code.
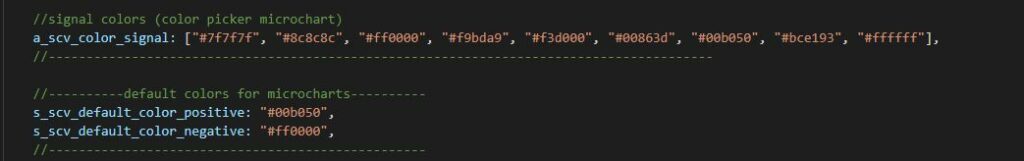
And the signal color array which contains colors that are mostly used for signals, traffic lights or deviations. This also contains standard colors for signals and can also be configured by adding colors using hexcode.
Default Colors
Standard colors are already defined for positive and negative signals, but these can also be adjusted in the config file.
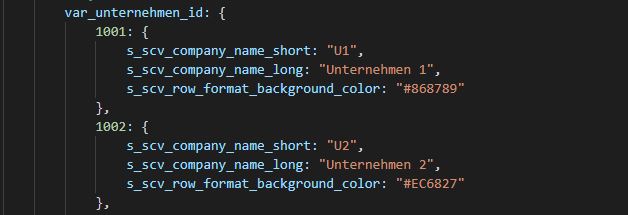
Company Parameter
Individual SCvation visualizations also offer so-called company parameters in the config file. This is used to store different formatting for the visualization if their keywords or IDs appear and thus an automatic formatting of the visualization element can take place.
These company parameters can be adjusted or declared in the config file or in consultation before delivery.
User Guide
Overview
The SCvation visualizations are available for MicroStrategy to visualize the data in the report.
Color
Color menu
The color menu was specially developed for the SCvation visualizations. This can be used with different color palettes.
In the SCvation visualizations there are two predefined color palettes, one for signal colors or deviations and one for all other formatting settings. Using a color palette allows user-friendly color settings.
Color palette
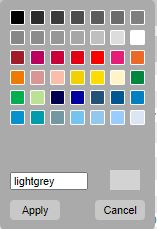
Standard Colors
The default color palette containing a predefined range of color values (hexcodes) displayed in the Colors menu. This palette can be predefined for each company so that the standard group colors are already available there. In addition, any color can be set by entering the hex code in the text field.
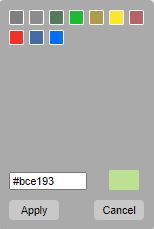
Signal Colors
The signal color menu containing a predefined color palette for signals/deviations. This palette contains default colors for positive and negative signals/deviations, but groups can also be added. In addition, any color can be set by entering the hex code in the text field.
Conditional formatting
Conditions menu
The condition menu was specially developed for the SCvation visualizations to make it easier to set conditions.
Different types of condition menus are available in the SCvation visualizations:
- Matching with formatting variables
- Activation/deactivation of visualization building blocks
- Replace numbers/texts
- Defining conditions (signals/traffic lights)
- Condition to change formatting
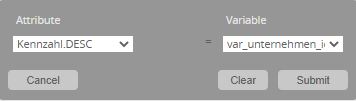
Matching with formatting variables
This condition compares whether an object with parameters is created for an attribute in the configuration file, which corresponds to the content of the attribute and stores this formatting for the visualization.
- Attribute selector
- Selection of the attribute to be used for comparison with the variables. All available attributes are listed
- Variablen selector
- Selection of the variable object that was defined by the administrator or when the visualization was delivered in the config file.
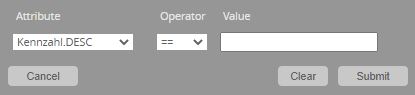
Activation/deactivation of visualization building blocks
This condition compares an attribute to an entered number or entered text. By comparing the attribute, sections and bars can be changed or activated or deactivated based on a filter in MicroStrategy.
- Attribute selector
- Selection of the attribute whose data/content is to be compared.
This should also be used as a filter for the dossier, the visualization.
- Selection of the attribute whose data/content is to be compared.
- Comparison operator selector
- ==
- !=
- IN
- NOT IN
- Value input
- Enter a number/text to be compared.
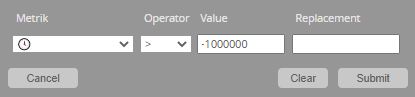
Replacement of numbers/texts
This condition is used to replace numbers with other numbers, text or symbols if they have a certain value, exceed or fall below it.
- Metric selector
- Selection of the metric whose data is to be compared
- Comparison operator selector
- <
- >
- ==
- !=
- <=
- >=
- Value Input
- Enter a number to compare with.
- Replacement input
- Enter a number, text, or symbol to replace the number in the column
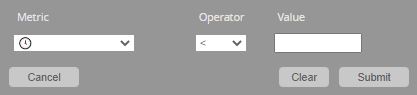
Defining conditions (signals, traffic lights)
This condition compares a metric to an entered value to display a signal or traffic light icon. This condition can usually be used multiple times to define multiple symbols.
- Metric selector
- Selection of the metric whose data is to be compared
- Comparison operator selector
- <
- >
- ==
- !=
- <=
- >=
- Value input
- Enter a number to compare with.
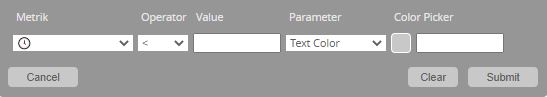
Condition to change formatting
This condition compares the metric data to an entered value and then uses this comparison to apply the selected parameter formatting
- Metric selector
- Selection of the metric whose data is to be compared
- Comparison operator selector
- <
- >
- ==
- !=
- <=
- >=
- Value input
- Enter a number to compare with.
- Parameter selector
- Selection of which parameters are to be changed Selection:
- Text Color
- Selection of which parameters are to be changed Selection:
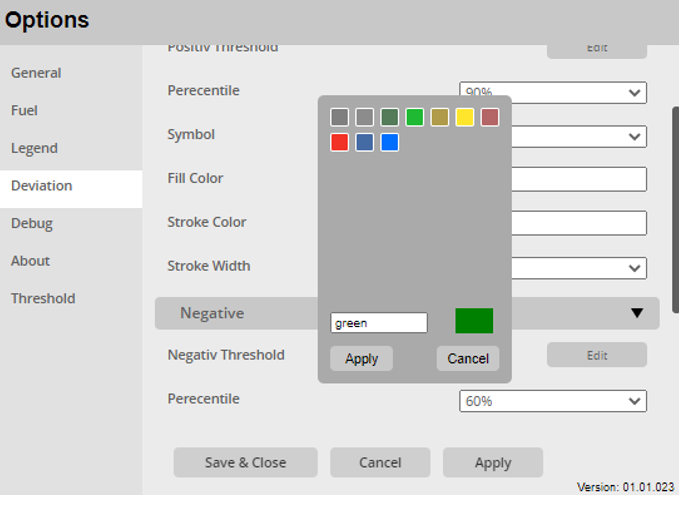
- Color Picker
- Selection of the color to be used if the condition is met
- Color Menu:
- The color can be selected using buttons.
- The colors of the buttons are predefined and can be customized for the specific company.
- Using the text field in the color menu, additional colors can be added using a hex code
- Color Menu:
- Selection of the color to be used if the condition is met
IBCS-Format
IBCS Definition
The International Business Communication Standard, IBCS for short, was developed to simplify business communication, to shorten it but still make it clearer.
Therefore IBCS offers a template for the presentation of business data in visualization. This mainly refers to the presentation of the data and its specific formatting of the bar, line or table in which that data is presented.
IBCS-Format
Formatting templates are given for plan, actual, previous year and forecast values:
- Plan
- Bar
- Fill Color: White
- Border: Dark Gray / Black
- Line
- Double Line
- Both lines are dark grey
- Bar
- Actual
- Bar
- Fill Color: Dark Grey / Black
- Border: Dark Grey / Black
- Line
- Solid Line
- Dark Grey / Black
- Bar
- Previous year
- Bar
- Fill Color: Light Grey
- Border: Light Grey
- Line
- Solid Line
- Light Grey
- Bar
- Forecast
- Bar
- Fill Color: Dark Grey Pattern
- Border: Dark Grey
- Line
- Dashed Line
- Dark Grey
- Bar
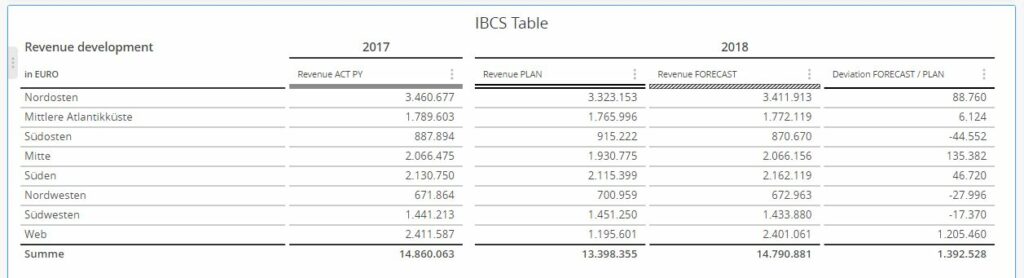
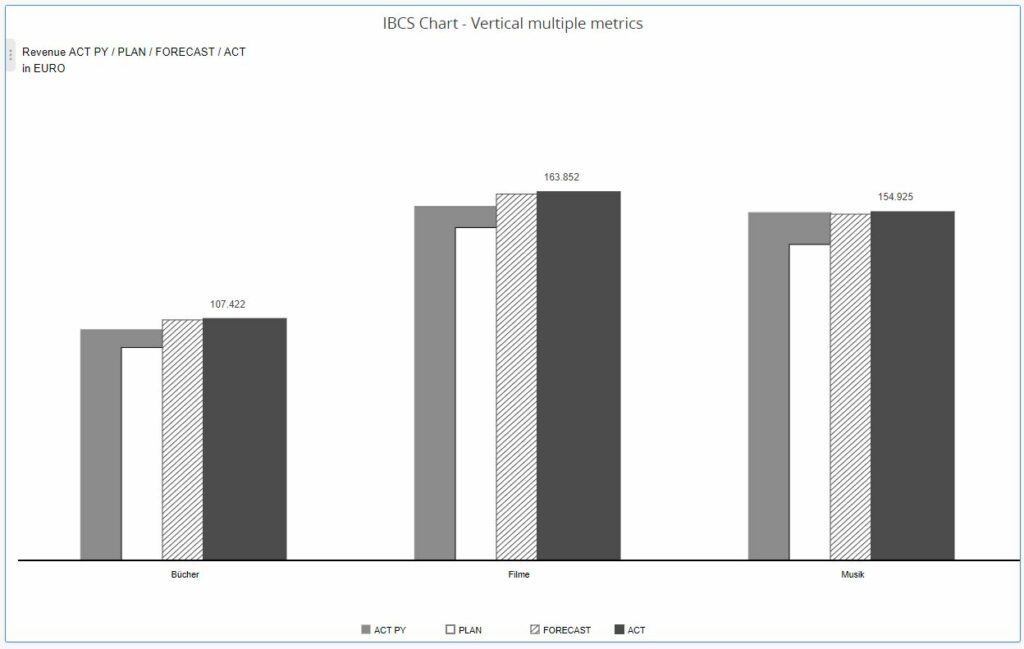
IBCS Formate by SCvation
Examples from the SCvation table and the SCvation graph of how an IBCS-compliant format looks for the SCvation visualizations.
Examples:
SCvation Tabel
SCvation Graph
Browser
The SCvation visualizations for Power BI are available for use in different browsers.
Supported Browser
- Windows operating System (PC)
- Opera (ab Version 38)
- Edge (ab Version 79)
- Firefox (ab Version 54)
- Chrome (ab Version 51)
- iOS operating System
- Safari (ab Version 10)
- Android operating System
- Firefox (ab Version 54)
- Chrome (ab Version 51)
Not supported Browser
Browsers in which the SCvation visualizations are not supported.
- Internet Explorer
Export
Export of SCvation Visuals
Overview of the export possibilities of the SCvation visualizations
Excel-Export
The Excel export of self-built visualizations is not possible because this is not supported by MicroStrategy.
PDF-Export
All SCvation visualizations can be exported from the dossier, the web and the library as PDF.
Export to PDF using the same process as the pre-built MicroStrategy visualizations.