
Documentation - Graph
Overview Graph
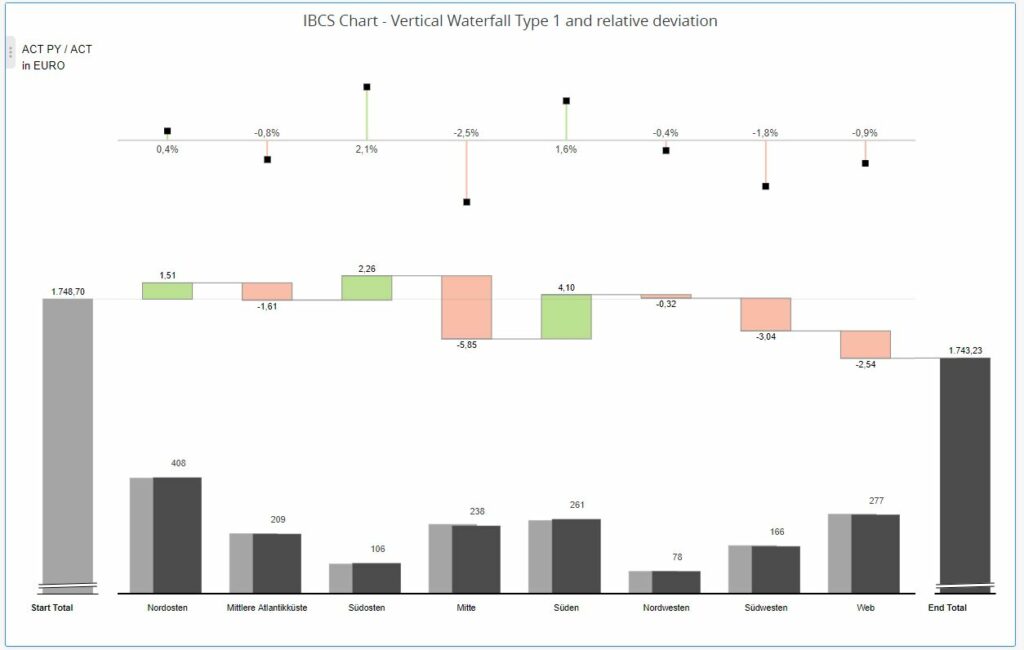
The SCvation Graph visualization is a visual support and representation of business data in a bar graph. This can also be formatted in accordance with the IBCS standard. Using conditions, the bars can be switched on or off through the menu. In addition, there is a huge selection of formatting options available to the user through the menu.
In addition, different displays of the deviations and other information, such as targets or totals, can be added to the bars.
The size of these individual ads can be individually adjusted by the user.
Drop Zone
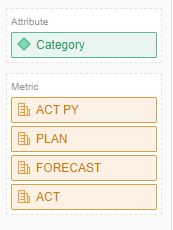
- Attribute
- 4 x Attribute
- Contains the attribute content that splits the bars and contains x-axis labels, moreover, attributes can be added for filtering and for the thresholds.
- Metric
- 8 x Metriken
- Contains the data to be displayed as a bar, target or deviation.
Options-Menü
Menü einblenden
Pressing this button opens the SCvation menu.
Various settings and formatting of the visualization can be changed with the menu.
General
General > General
General settings for orientation, display of visualization components and number formatting are made in the options menu General > General.
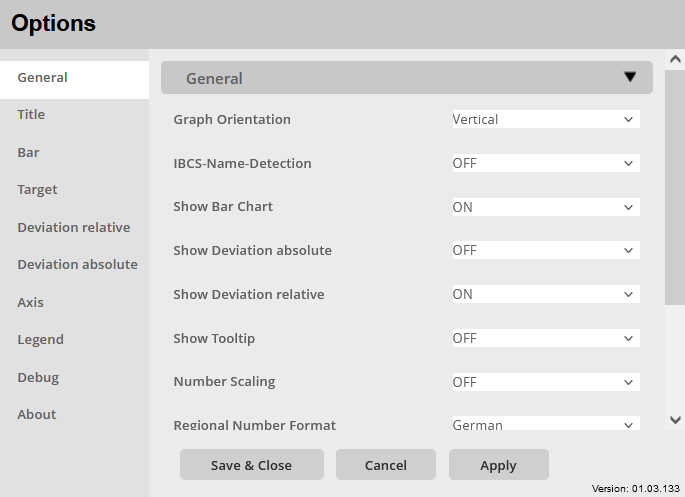
Graph Orientation:
Option to set the orientation of the graph.
The orientation of the bars and the deviations are specified
The following options are available:
- Horizontal
- The bars are displayed horizontally, so they span from left to right and the bars are displayed one below the other. The bars of the deviation and the waterfall as well as the needles of the relative deviation are also aligned horizontally.
- Vertical
- The bars are displayed vertically, so they span from bottom to top and the bars are displayed side by side. The bars of the deviation and the waterfall as well as the needles of the relative deviation are also aligned horizontally.
IBCS-Name-Detection:
Enable/disable automatic recognition of IBCS formats based on metric names.
- ON
- Automatic IBCS detection is activated
- OFF
- Automatic IBCS detection is not activated.
If a metric is recognized based on its name, the associated bars are automatically formatted with the specified formatting behind the respective name
Show BarChart:
Activate/deactivate the bar display: ON / OFF
Show Deviation absolute:
Activation/deactivation of the display of the absolute deviation, in addition the option of how the absolute deviation should be displayed?
- OFF
- none Absolute deviation is displayed
- Normal
- the absolute deviation is normally represented by means of bars
- Waterfall Type 1
- the absolute deviation is shown as a waterfall. The totals start at the same height as the bars.
- Waterfall Type 2
- the absolute deviation is shown as a waterfall. The totals are included in the waterfall display and start in the waterfall visualization module and are therefore independent of the bars.
- Absolute &Waterfall 1
- The Absolute Deviation is shown as normal and as a Type 1 waterfall.
- Absolute &Waterfall 2
- Absolute Deviation is shown as normal and as a Type 2 waterfall.
Show Deviation relative:
Activate/deactivate the display of the relative deviation: ON / OFF
Show Tooltip:
Activate/deactivate the display of tooltips: ON / OFF
Number Scaling:
Option to break down the numbers of the visualization.
- OFF
- Tausend [K]
- Millionen [M]
- Billionen [G]
In this format, the payers are taken over for the visualization and taken over for the calculations and representations.
Regional Number Format:
Option to assign the regional number format to the visualization. In particular, this is about the representation of the comma and the thousands separator. A distinction is made between German and English format.
- German
- Thousand separators: “.”
- Decimal place: “,”
- English
- Thousand separators: “,“
- Decimal place: “.“
General > Container Size
Specific settings for the container size of the visualization building blocks are made in the options menu General > Container Size.
The container sizes of the blocks displayed must not exceed a sum of 100%. This includes the building blocks:
- Axis
- Bar chart
- Waterfall
- Deviation absolute
- Deviation relative
- Legend
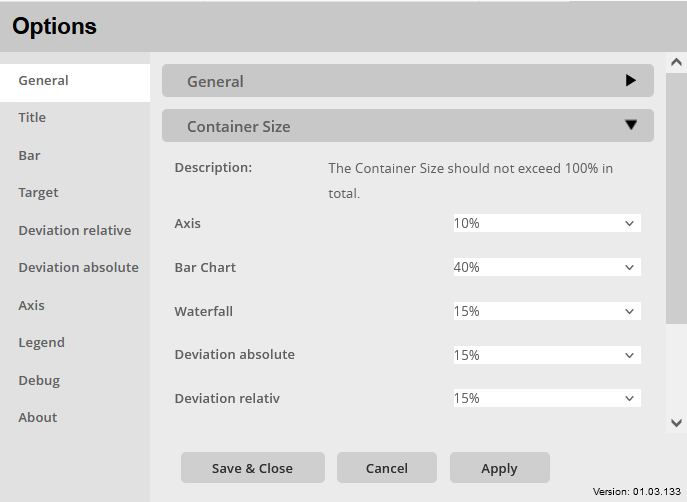
Axis:
Define the container size of the X-axis visualization building block: 0% – 50% in 5% steps.
Bar Chart:
Define the container size of the Bar Chart visualization building block: 0% – 90% in 5% steps
Waterfall:
Define the container size of the waterfall visualization building block: 0% – 90% in 5% steps
Deviation absolute:
Define the container size of the Deviation absolute visualization building block: 0% – 90% in 5% steps
Deviation relative:
Define the container size of the Deviation relative visualization building block: 0% – 90% in 5% steps
Legend:
Define the container size of the legend: 5% – 50% in 5% steps
General > Metrics
Specific settings for the metrics are made in the options menu General > Metrics.
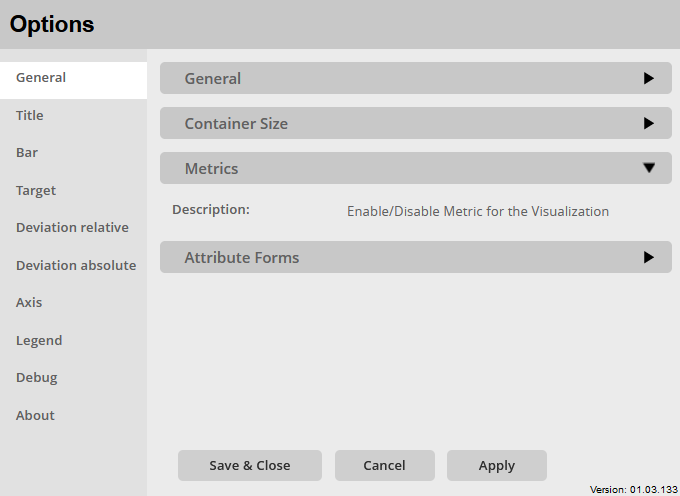
Metrics:
Enable/disable the metrics for the visualization.
In addition, a type can be added to the metrics. The metrics can be declared as follows:
- OFF
- The metric is disabled for the visualization.
- Bar
- The metric is represented as a bar
- Target
- The metric is represented as a target
General > Attribute Forms
Specific settings for the attribute forms are made in the options menu General > Attribute Forms.
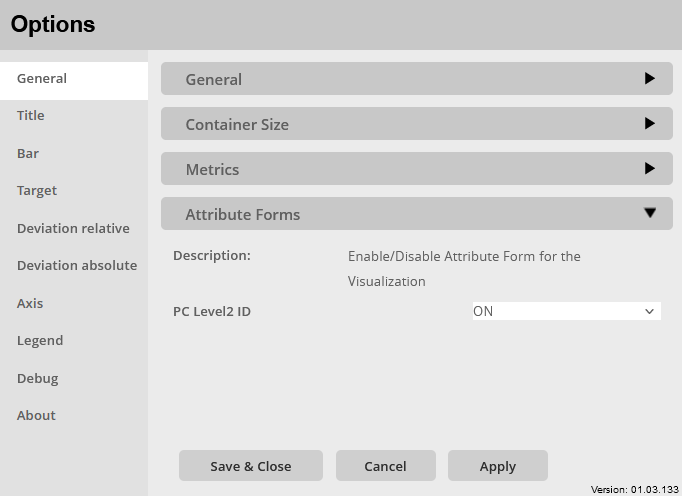
Attribute Forms:
Enable/Disable Attribute Forms for visualization: ON / OFF
The selected attribute shape is then used to split the bars and the content is displayed in the x-axis.
Title
Title > Title
Specific settings for the title of the visualization are made in the options menu Title > Title.
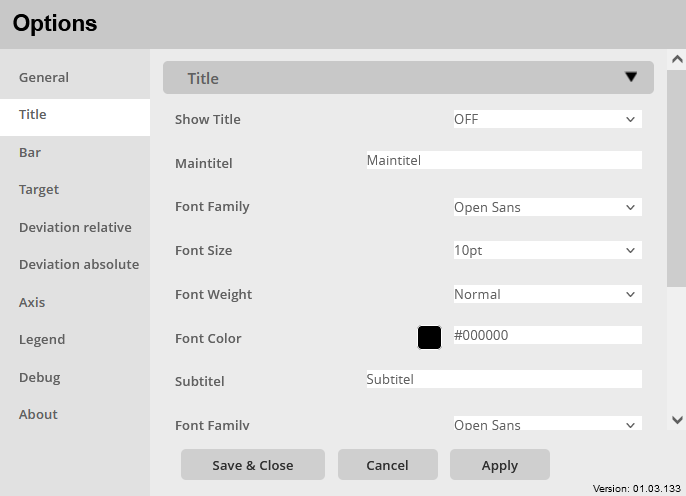
Show Title:
Activate/deactivate the display of the title: ON / OFF
Maintitle:
Assignment of an additional main title, which is also displayed in the visualization.
- Text input field
- Enter the title in the text field, this will be accepted unformatted.
Font Family:
Setting to set the font family of the title. There are multiple fonts to choose from, including:
- Arial
- Open Sans
- Segoe UI
Font Size:
Setting the font size for the title, there is a choice of font sizes:
- 6pt-14pt
Font Weight:
Setting the font weight for the title, choice between:
- Normal
- Bold
Font Color:
Setting the font color for the title.
Color selection:
- Color menu:
- The color can be selected using buttons.
- The colors of the buttons are predefined and can be customized for the specific company.
- Using the text field in the color menu, additional colors can be added using a hex code.
Subtitle:
Assignment of an additional second title, which is also displayed in the visualization.
- Text input field
- Enter the title in the text field, this will be accepted unformatted.
Font Family:
Setting to set the font family of the title. There are multiple fonts to choose from, including:
- Arial
- Open Sans
- Segoe UI
Font Size:
Setting the font size for the title, there is a choice of font sizes:
- 6pt-14pt
Font Weight:
Setting the font weight for the title, choice between:
- Normal
- Bold
Font Color:
Setting the font color for the title.
Color selection:
- Color menu:
- The color can be selected using buttons.
- The colors of the buttons are predefined and can be customized for the specific company.
- Using the text field in the color menu, additional colors can be added using a hex code.
Position:
Setting for the position of the titles, choice between:
- Left
- Center
- Right
Bar
Select a Section/Metric:
Selector to choose the metric for which the following bar formatting should be done.
It should be noted here that only the metrics that are declared as bars can be selected.
Bar > General
General settings for bar formatting are made in the options menu Bar > General.
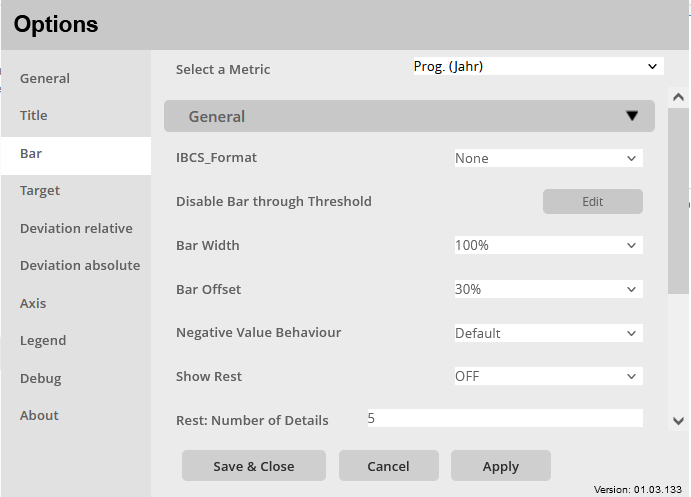
IBCS -Format:
An IBCS format can be assigned to the selected bar metric, according to which this bar is to be formatted. This option can already be set by the automatic detection in the General > General menu.
Disable Bar through Threshold:
Set a condition when this bar/metric should not be displayed as a bar.
- Attribute selector
- Selection of the attribute whose data/content is to be compared
- Comparison operator selector
- ==
- !=
- IN
- NOT IN
- Value input
- Enter a number/text to be compared.
Bar Width:
Setting the general bar width: 10% – 100%
This setting applies to all bars regardless of the selected metric!
Bar Offset:
Adjustment of the distance/overlap of the bars to each other: 10% – 130%
This setting applies to all bars regardless of the selected metric!
Negative Value Behaviour:
Setting for how the visualization should handle negative numbers.
- Default
- Normal handling of negative numbers, these are displayed in contrast to the positive numbers. Positive numbers are displayed up or to the right, negative numbers are displayed down or left.
- Only Positive
- Only the positive numbers are displayed and negative numbers are discarded.
- Absolute Values
- All numbers in absolute are displayed. The negative numbers are drawn in the same direction as the positive numbers as bars, but are denoted as negative by your arrow.
This setting applies to all bars regardless of the selected metric!
Show Rest:
Activate/deactivate the detail view: ON / OFF
By activating, a number of bars, which is defined in the next menu item, is displayed as details, all other bars are summarized as the remainder and added as a group at the end.
This setting applies to all bars regardless of the selected metric!
Rest: Number of Details:
Definition of the number of bars to be displayed in detail.
- Text input field
- Enter a number in the text field, this determines the number of bars that are displayed as a detail.
This setting applies to all bars regardless of the selected metric!
Show Totals:
Enable/disable display of calculated sum of displayed bars.
Which is then added to the bars at the end as a separate group: ON / OFF
This setting applies to all bars regardless of the selected metric!
Bar > Format
In the options menu Bar > Format specific settings for the bar formatting are made.
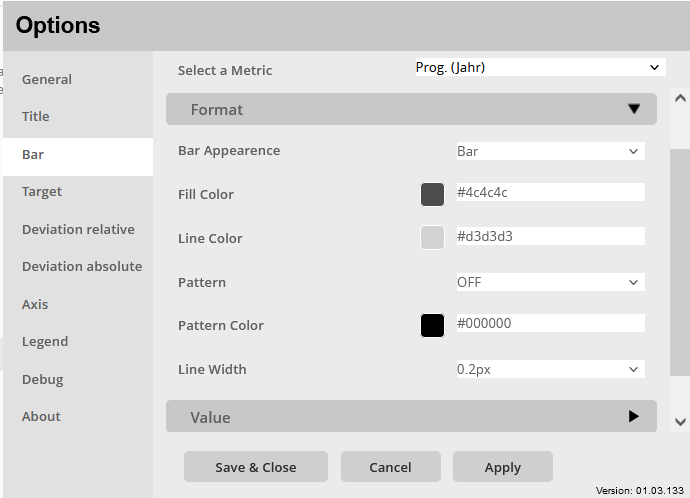
Bar Appearence:
Setting for the display of the bar. Selection of the form in which the bar should be displayed.
- Bar
- Line
- Arrow
Fill Color:
Setting a fill color of the bar.
Color selection:
- Color menu:
- The color can be selected using buttons.
- The colors of the buttons are predefined and can be customized for the specific company.
- Using the text field in the color menu, additional colors can be added using a hex code.
Line Color:
Setting the line color for the border of the bar.
Color selection:
- Color menu:
- The color can be selected using buttons.
- The colors of the buttons are predefined and can be customized for the specific company.
- Using the text field in the color menu, additional colors can be added using a hex code.
Pattern:
Enable/disable filling the bar with a pattern: ON / OFF
Pattern Color:
Set the color of the bar hatching when enabled.
Color selection:
- Color menu:
- The color can be selected using buttons.
- The colors of the buttons are predefined and can be customized for the specific company.
- Using the text field in the color menu, additional colors can be added using a hex code.
Line Width:
Setting the line thickness for the border of the bar.
Choice for formatting:
- OFF
- 0.1px – 8px
Bar > Value
In the options menu Bar > Value specific settings for the bar number formatting are made.
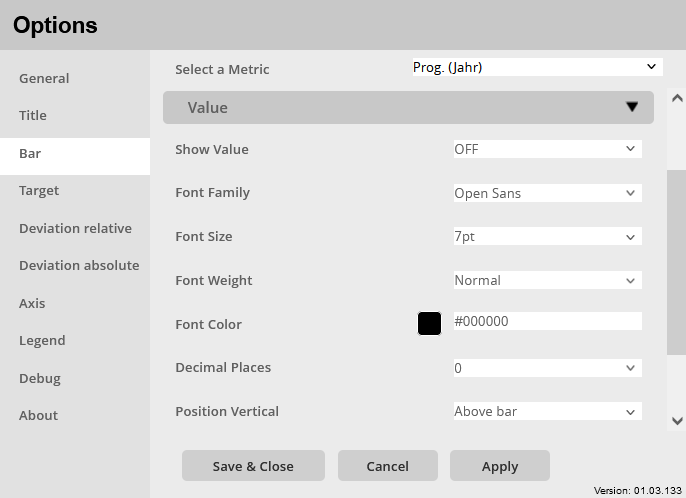
Show Value:
Activate/deactivate the display of the bar numbers: ON / OFF
Font Family:
Setting to set the font family of the bar value. There are multiple fonts to choose from, including:
- Arial
- Open Sans
- Segoe UI
Font Size:
Setting the font size for the numbers displayed in the bars, a selection of font sizes is specified:
- 6pt-12pt
Font Weight:
Setting the font weight for the numbers displayed in the bars.
Choice between:
- Normal
- Bold
Font Color:
Option to change the font color.
Color selection:
- Color menu:
- The color can be selected using buttons.
- The colors of the buttons are predefined and can be customized for the specific company.
- Using the text field in the color menu, additional colors can be added using a hex code.
Decimal places:
Set the number of decimal places for the numbers of the bars.
selection: 0 – 5
Position vertical:
Setting for the vertical positioning of the numbers.
Selection:
- Above Bar
- The number is displayed above the associated bar
- Center of Bar
- The number is displayed in the middle of the corresponding bar
- Bottom of Bar
- The number is displayed at the beginning of the associated bar above the X-axis.
- Above Max Bar
- The number is displayed above the associated bar, but set above the height of the tallest bar in the bar group.
Position horizontal:
Settings for the horizontal positioning of the numbers.
Selection:
- Left
- The number is displayed left-aligned on the associated bar.
- Center
- The number is displayed in the middle of the associated bar.
- Right
- The number is displayed right-justified on the associated bar.
Bar > Advanced
In the Options menu Bar > Advanced connections between attributes and variables can be created.
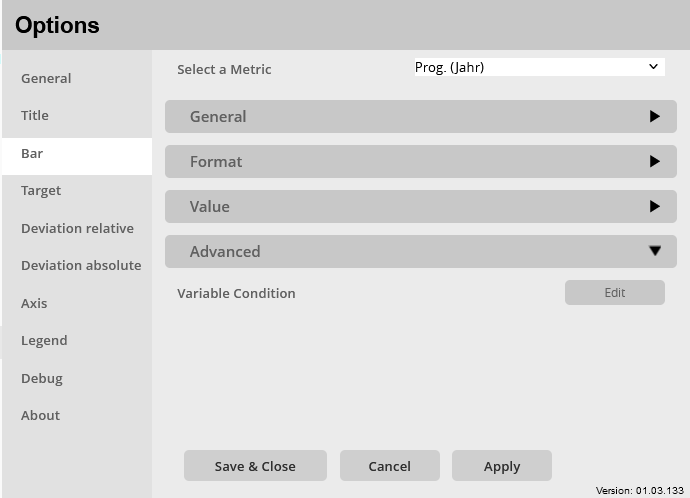
Variable Condition:
Set a condition to connect/equate an attribute and a variable.
- Attribute Selector
- Selection of an attribute.
- Variable Selector
- Selection of a variable.
Target
Select a Section/Metric:
Selektor for selecting the metric for which the following target formatting should be done.
It should be noted here that only metrics that are declared as a target in General > General are available for selection.
It should therefore always be checked whether the metric is correctly declared.
Target > Target
General and specific settings for target formatting are made in the Target > Target options menu.
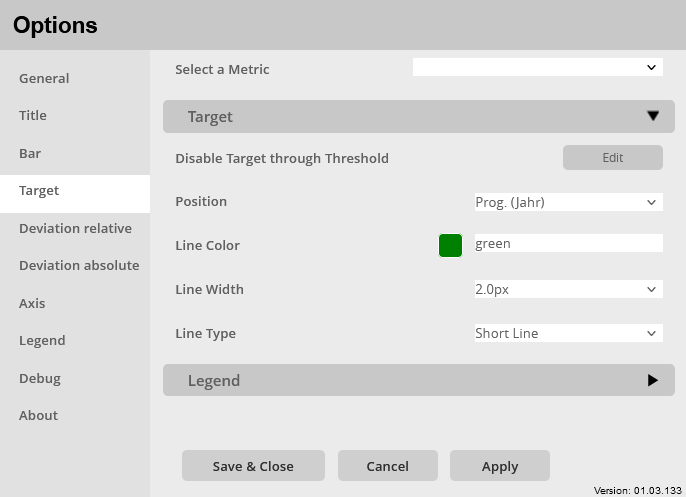
Disable Target through Threshold:
Setting a condition when this target/this metric should not be displayed as a target.
- Attribute selector
- Selection of the attribute whose data/content is to be compared
- Comparison operator selector
- ==
- !=
- IN
- NOT IN
- Value input
- Enter a number/text to be compared.
Position:
Setting for declaration of the target position. Assignment of the target to a bar/metric.
- Selector
- Selection of the metric name/bar to which the targets should be assigned
- Only metrics that are declared as bars are available for selection
Line Color:
Setting the line color of the target.
Color selection:
- Color menu:
- The color can be selected using buttons.
- The colors of the buttons are predefined and can be customized for the specific company.
- Using the text field in the color menu, additional colors can be added using a hex code.
Line Width:
Setting the line thickness targets.
Choice for formatting:
- Very Fine
- Fine
- Normal
- Bold
Line Type:
Setting the line type for the target.
Selection for the line type:
- Short Line
- The target is shown as a short line in the middle of the associated bar
Target > Legend
In the options menu Target > Legend specific settings for the target legend, in particular the label formatting, are made.
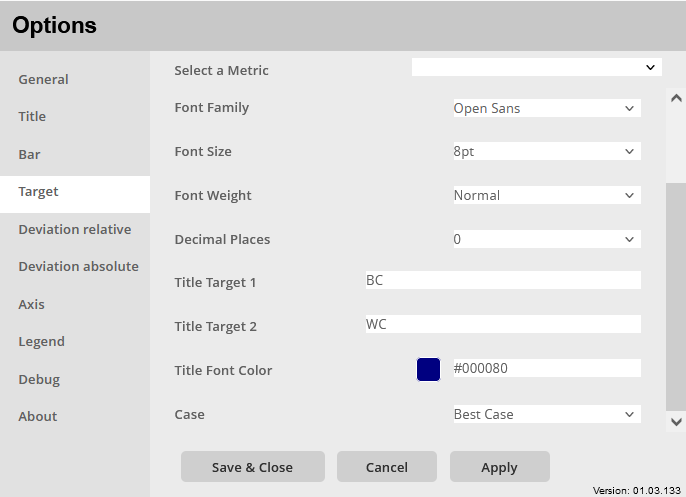
Font Family:
Setting to set the font family of the legend. There are multiple fonts to choose from, including:
- Arial
- Open Sans
- Segoe UI
Font Size:
Setting the font size for the displayed numbers/texts of the targets in the legend, a selection of font sizes is specified:
- 6pt-14pt
Font Weight:
Setting the font weight for the displayed numbers/texts of the targets in the legend.
Choice between:
- Normal
- Bold
Decimal places:
Set the number of decimal places for the target numbers in the legend.
selection: 0 – 5
Target Title 1:
Allocation of an additional best case title, which is also displayed in the legend in the best case.
- Text input field
- Enter the title in the text field, this will be accepted unformatted.
Target Title 2:
Assignment of an additional worst case title, which is also displayed in the legend in the worst case.
- Text input field
- Enter the title in the text field, this will be accepted unformatted.
Title Font Color:
Setting a color for the two Target legend titles.
Color selection:
- Color menu:
- The color can be selected using buttons.
- The colors of the buttons are predefined and can be customized for the specific company.
- Using the text field in the color menu, additional colors can be added using a hex code.
Case:
Setting for the assignment of the target values that are displayed in the legend. The values are displayed in the top row when they are declared as best case and in the bottom row when they are declared as worst case.
- Best Case
- Worst Case
In addition, the values position themselves in the column of the bar/metric to which the tag is assigned.
Deviation relative
Deviation relative > Deviation relatives Forms
General settings for the relative deviation are made in the options menu Deviation relative > Deviation relative Forms. In particular, the calculation of the relative deviation is specified.
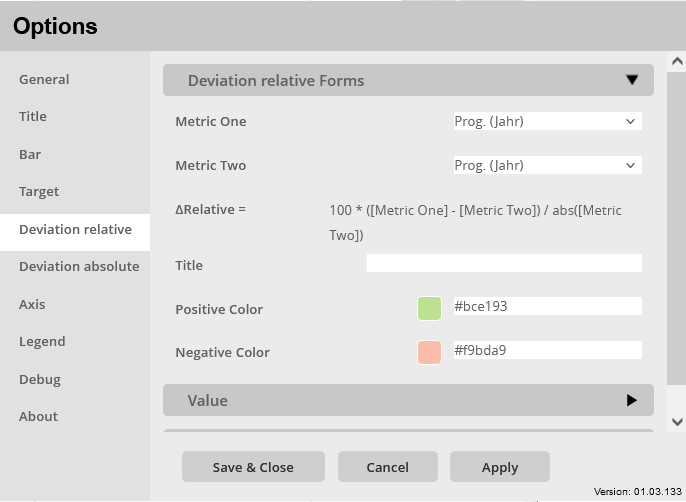
Metric One:
Selection of the first metric for the relative deviation calculation.
All available metrics are available for selection.
Metric Two:
Selection of the first metric for the relative deviation calculation.
All available metrics are available for selection.
ΔRelative:
Illustration of how the relative deviation is calculated with the two selected metrics.
- Calculation:
- 100 × ([Metric One] – [Metric Two]) ÷ abs([Metric Two])
Title:
Assignment of an additional title for the Relative Deviation, which is displayed in the Relative Deviation shelf
- Text input field
- Enter the title in the text field, this will be accepted unformatted.
Positive Color:
Setting a signal color for the positive relative deviation. the line of the needle that indicates the relative deviation gets this color.
Color selection:
- Color menu:
- The color can be selected using buttons.
- The colors of the buttons are predefined and can be customized for the specific company.
- Using the text field in the color menu, additional colors can be added using a hex code.
Negative Color:
Setting a signal color for the negative relative deviation. the line of the needle that indicates the relative deviation gets this color.
Color selection:
- Color menu:
- The color can be selected using buttons.
- The colors of the buttons are predefined and can be customized for the specific company.
- Using the text field in the color menu, additional colors can be added using a hex code.
Deviation relative > Values
Im Options-Menü Deviation relative > Values werden gezielte Einstellungen für die Zahlen der relative Abweichung vorgenommen.
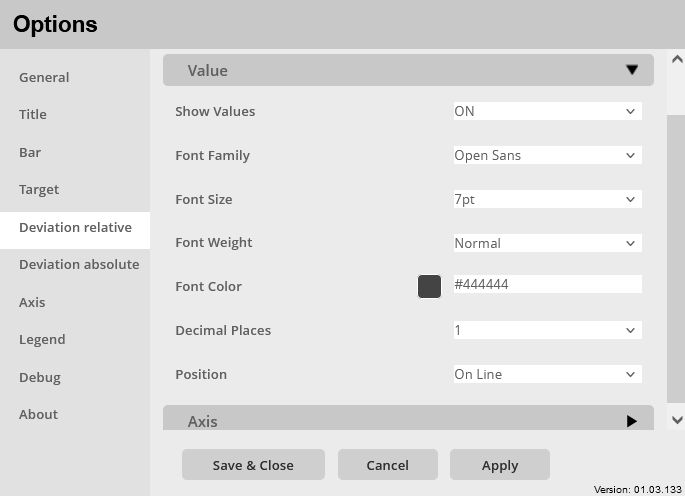
Show Values:
Enable/disable the display of the calculated relative deviation numbers: ON / OFF
Font Family:
Setting to set the font family of the values. There are multiple fonts to choose from, including:
- Arial
- Open Sans
- Segoe UI
Font Size:
Setting the font size for the displayed numbers of the relative deviation, a selection of font sizes is given:
- 6pt-12pt
Font Weight:
Setting the font weight for the displayed numbers of the relative deviation.
Choice between:
- Normal
- Bold
Font Color:
Setting to choose the font color of the values.
Color selection:
- Color menu:
- The color can be selected using buttons.
- The colors of the buttons are predefined and can be customized for the specific company.
- Using the text field in the color menu, additional colors can be added using a hex code.
Decimal places:
Set the number of decimal places for the relative deviation numbers.
selection: 0 – 5
Position:
Setting the value position of the relative deviation.
selection:
- Above Deviation
- The number is displayed above the relative deviation needle
- On Line
- The number is displayed opposite the needle on the other side of the X-axis of relative deviation.
Deviation relative > Axis
In the Options menu Deviation relative > Axis, specific settings are made for the axis of the relative deviation.
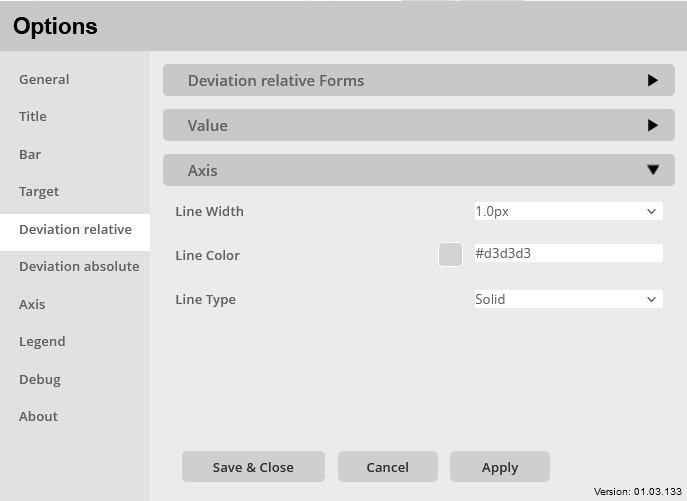
Line Width:
Setting to determine the width of the axis. Choose from:
- OFF
- 0.1px – 8px
Line Color:
Setting to choose the line color of the axis.
Color selection:
- Color menu:
- The color can be selected using buttons.
- The colors of the buttons are predefined and can be customized for the specific company.
- Using the text field in the color menu, additional colors can be added using a hex code.
Line Type:
Setting to choose the appearence of the axis. Avalible options:
- Solid
- Double
Deviation absolute
Deviation absolute > General
General settings for the absolute deviation are made in the options menu Deviation absolute > General. In particular, the calculation of the absolute deviation is specified.
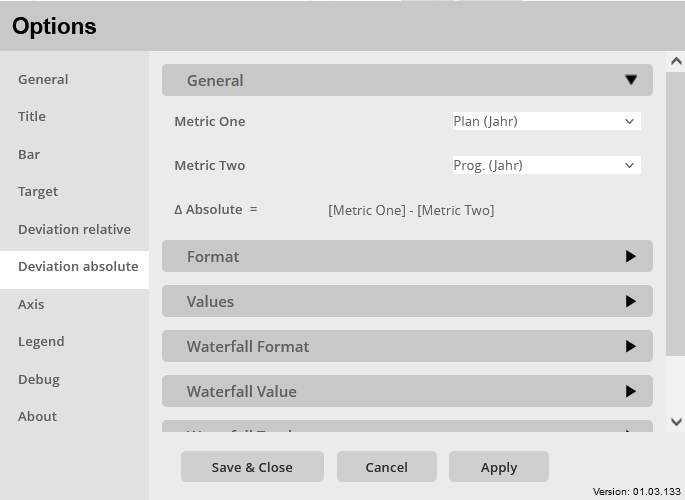
Metric One:
Selection of the first metric for the calculation of the absolute deviation.
All available metrics are available for selection.
Metric Two:
Selection of the second metric for the calculation of the absolute deviation.
All available metrics are available for selection.
ΔAbsolute:
Illustration of how the absolute deviation is calculated with the two selected metrics.
- Calculation:
- [Metric One] – [Metric Two])
Deviation absolute > Format
General settings for the absolute deviation are made in the options menu Deviation absolute > Format. In particular, the formatting of the absolute deviation is specified.
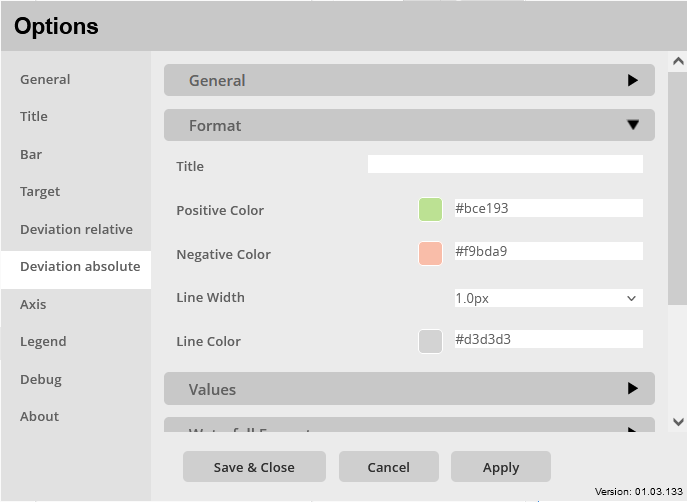
Title:
Assignment of an additional title for the absolute deviation, which is displayed in the absolute deviation shelf
- Text input field
- Enter the title in the text field, this will be accepted unformatted.
Positive Color:
Setting a signal color for the positive absolute deviation. the positive bar is filled with this color.
Color selection:
- Color menu:
- The color can be selected using buttons.
- The colors of the buttons are predefined and can be customized for the specific company.
- Using the text field in the color menu, additional colors can be added using a hex code.
Negative Color:
Setting a signal color for the negative absolute deviation. the negative bar is filled with this color.
Color selection:
- Color menu:
- The color can be selected using buttons.
- The colors of the buttons are predefined and can be customized for the specific company.
- Using the text field in the color menu, additional colors can be added using a hex code.
Line Width:
Setting of the line thickness for the borders of the bars of the absolute deviation.
Choice for formatting:
- Very Fine
- Fine
- Normal
- Bold
Line Color:
Setting the line color for the absolute deviation bar border.
Color selection:
- Color menu:
- The color can be selected using buttons.
- The colors of the buttons are predefined and can be customized for the specific company.
- Using the text field in the color menu, additional colors can be added using a hex code.
Deviation absolute > Values
In the options menu Deviation absolute > Values specific settings for the numbers of the absolute deviation are made.
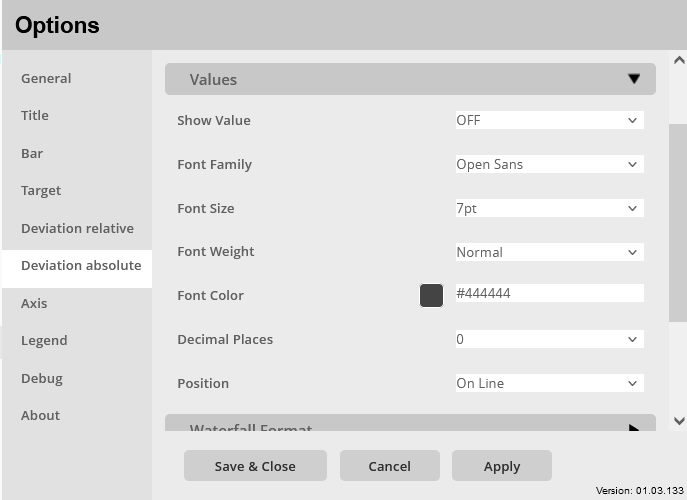
Show Value:
Enable/disable the display of the calculated absolute deviation numbers: ON / OFF
Font Family:
Setting to set the font family of the values. There are multiple fonts to choose from, including:
- Arial
- Open Sans
- Segoe UI
Font Size:
Setting the font size for the displayed numbers of the absolute deviation, a selection of font sizes is specified:
- 6pt-12pt
Font Weight:
Setting the font weight for the displayed numbers of the absolute deviation.
Choice between:
- Normal
- Bold
Font Color:
Setting to choose the font color of the values.
Color selection:
- Color menu:
- The color can be selected using buttons.
- The colors of the buttons are predefined and can be customized for the specific company.
- Using the text field in the color menu, additional colors can be added using a hex code.
Decimal places:
Set the number of decimal places for the absolute deviation numbers.
selection: 0 – 5
Position:
Setting the value position of the absolute deviation.
Selection:
- Above Deviation
- The number is displayed above the absolute deviation bars.
- On Line
- The number is displayed opposite the bar on the other side of the X-axis of absolute deviation.
Deviation absolute > Waterfall Format
In the Deviation absolute > Waterfall Format options menu, general settings for the waterfall display are made.
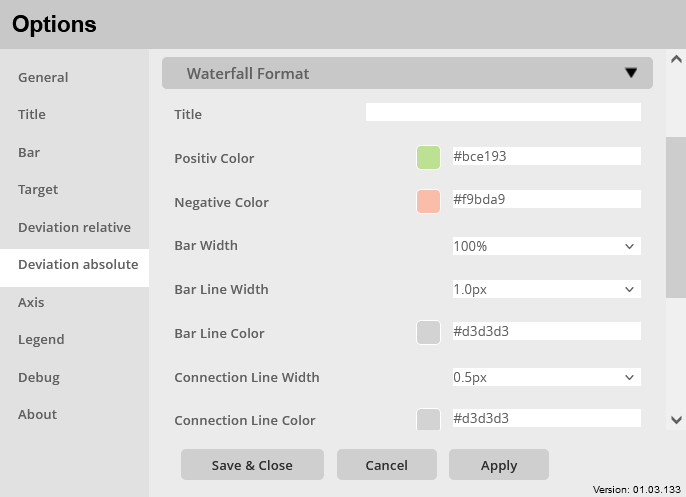
Title:
Assignment of an additional title for the waterfall that is displayed in the waterfall’s container
- Text input field
- Enter the title in the text field, this will be accepted unformatted.
Positive Color:
Setting a signal color for the positive waterfall bars.
Color selection:
- Color menu:
- The color can be selected using buttons.
- The colors of the buttons are predefined and can be customized for the specific company.
- Using the text field in the color menu, additional colors can be added using a hex code.
Negative Color:
Setting a signal color for the negative waterfall bars.
Color selection:
- Color menu:
- The color can be selected using buttons.
- The colors of the buttons are predefined and can be customized for the specific company.
- Using the text field in the color menu, additional colors can be added using a hex code.
Bar Width:
Setting the bar width for the waterfall bars.
Width selection: 50% – 140%
Bar Line Width:
Setting the line thickness for the borders of the bars of the waterfall
Choice for formatting:
- OFF
- 0.1px – 8px
Bar Line Color:
Setting the line color for the border of the waterfall bars.
Color selection:
- Color menu:
- The color can be selected using buttons.
- The colors of the buttons are predefined and can be customized for the specific company.
- Using the text field in the color menu, additional colors can be added using a hex code.
Connection Line Width:
Line thickness setting for the connecting line between the bars of the waterfall.
Choice for formatting:
- OFF
- 0.1px – 8px
Connection Line Color:
Setting the line color for the connecting lines between the bars of the waterfall.
Color selection:
- Color menu:
- The color can be selected using buttons.
- The colors of the buttons are predefined and can be customized for the specific company.
- Using the text field in the color menu, additional colors can be added using a hex code.
Middle Line Width:
Setting the line thickness for the X-axis of the waterfall.
Choice for formatting:
- OFF
- 0.1px – 8px
Middle Line Color:
Setting the line color for the X-axis of the waterfall.
Color selection:
- Color menu:
- The color can be selected using buttons.
- The colors of the buttons are predefined and can be customized for the specific company.
- Using the text field in the color menu, additional colors can be added using a hex code.
Deviation absolute > Waterfall Value
In the options menu Deviation absolute > Waterfall Value specific settings for the waterfall number formatting are made.
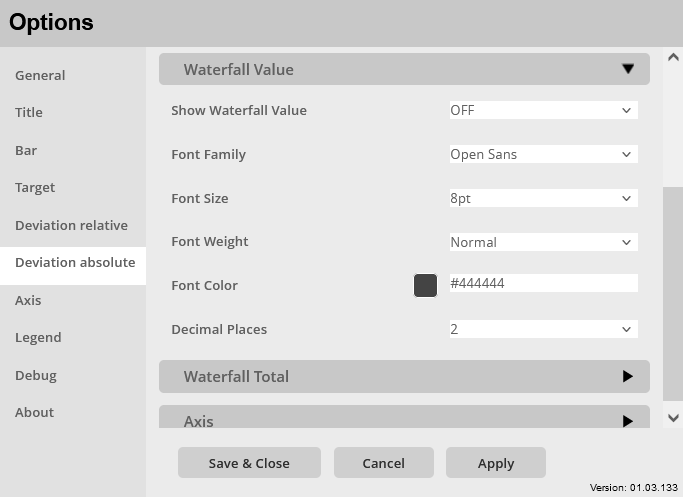
Show Waterfall Value:
Activate/deactivate the display of the numbers of the waterfall diagram: ON / OFF
Font Family:
Setting to set the font family of the values. There are multiple fonts to choose from, including:
- Arial
- Open Sans
- Segoe UI
Font Size:
Setting the font size for the displayed numbers of the waterfall, a selection of font sizes is given:
- 6pt-12pt
Font Weight:
Setting the font weight for the numbers displayed in the waterfall.
Choice between:
- Normal
- Bold
Font Color:
Setting to choose the font color of the values.
Color selection:
- Color menu:
- The color can be selected using buttons.
- The colors of the buttons are predefined and can be customized for the specific company.
- Using the text field in the color menu, additional colors can be added using a hex code.
Decimal places:
Set the number of decimal places for the waterfall numbers.
selection: 0 – 5
Deviation absolute > Waterfall Total
In the options menu Deviation absolute > Waterfall Total specific settings for the formatting of the waterfall totals are made.
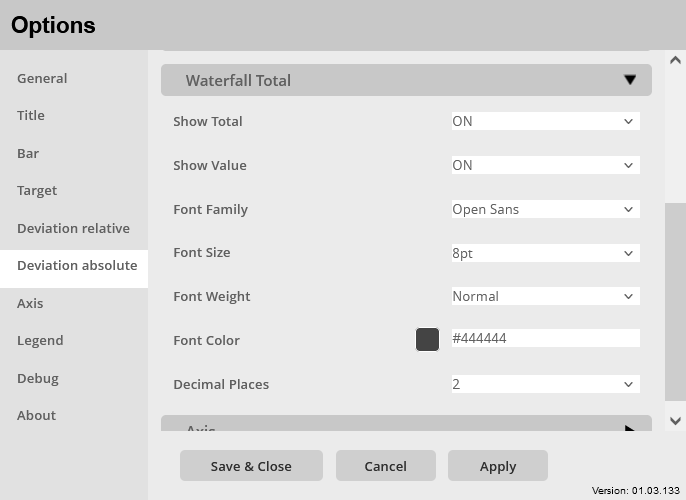
Show Total:
Enable/disable the display of waterfall totals: ON / OFF
Show Value:
Enable/disable the display of waterfall total numbers: ON / OFF
Font Family:
Setting to set the font family of the Total. There are multiple fonts to choose from, including:
- Arial
- Open Sans
- Segoe UI
Font Size:
Setting the font size for the displayed numbers of the waterfall totals, a selection of font sizes is given:
- 6pt-12pt
Font Weight:
Setting the font weight for the displayed numbers of the waterfall buzzer.
Choice between:
- Normal
- Bold
Font Color:
Setting to choose the font color of the total.
Color selection:
- Color menu:
- The color can be selected using buttons.
- The colors of the buttons are predefined and can be customized for the specific company.
- Using the text field in the color menu, additional colors can be added using a hex code.
Decimal places:
Set the number of decimal places for the waterfall sum numbers.
selection: 0 – 5
Deviation absolute > Axis
In the Options menu Deviation absolute > Axis specific settings for the axes formatting of the absolute deviation are made.
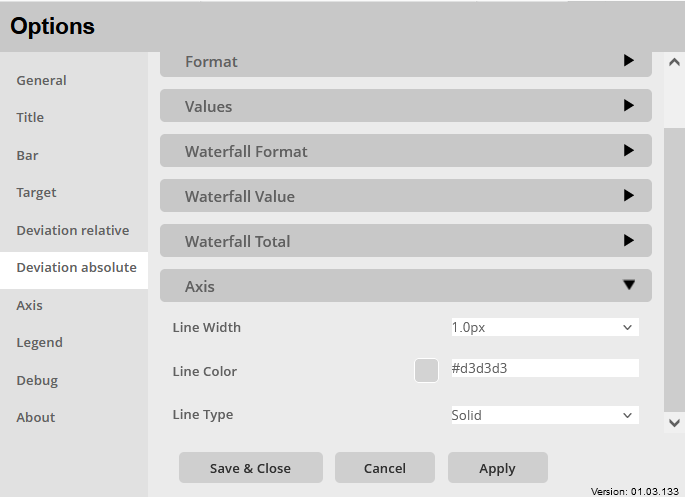
Line Width:
Setting to determine the width of the axis. Choose from:
- OFF
- 0.1px – 8px
Line Color:
Setting to choose the line color of the axis.
Color selection:
- Color menu:
- The color can be selected using buttons.
- The colors of the buttons are predefined and can be customized for the specific company.
- Using the text field in the color menu, additional colors can be added using a hex code.
Line Type:
Setting to choose the appearence of the axis. Avalible options:
- Solid
- Double
Axis
Axis > Format
General settings for the axis of the visualization are made in the options menu Axis > Format.
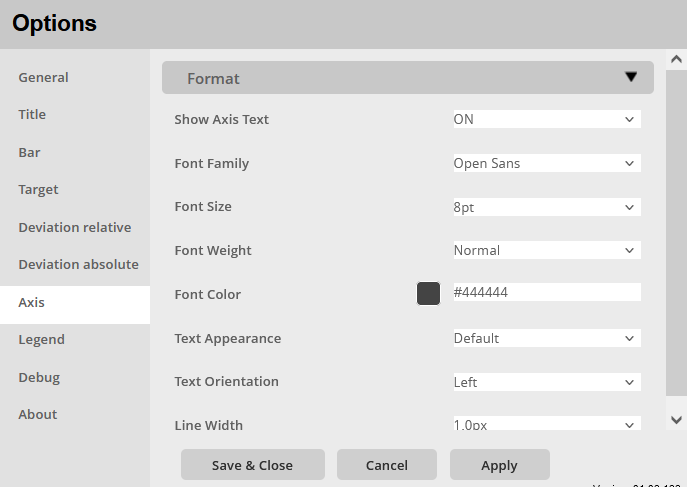
Show Axis Text:
Activate/deactivate the display of the axis of the visualization: ON / OFF
Font Family:
Setting to set the font family of the axis text. There are multiple fonts to choose from, including:
- Arial
- Open Sans
- Segoe UI
Font Size:
Setting the font size for the labeling of the axis, a selection of font sizes is specified:
- 6pt-14pt
Font Weight:
Setting the font weight for labeling the axis.
Choice between:
- Normal
- Bold
Text Apparence:
Setting for formatting the displayed text:
- Default
- The text is displayed unformatted, only the font weight and font size are adopted
- Line Break
- The label will automatically wrap if the displayed label is wider than the available axis space.
- Cut
- The label will be truncated if it is wider than the available axis space.
Text Orientation:
Settings for the horizontal orientation of the axis labels:
- Left
- The caption is left-aligned
- Center
- The caption is centered
- Right
- The caption is right-aligned
Line Width:
Setting the line thickness for the axis.
Choice for formatting:
- OFF
- 0.1px – 8px
Legend
Legend > Format
General settings for the legend of the visualization are made in the Legend > Format options menu.
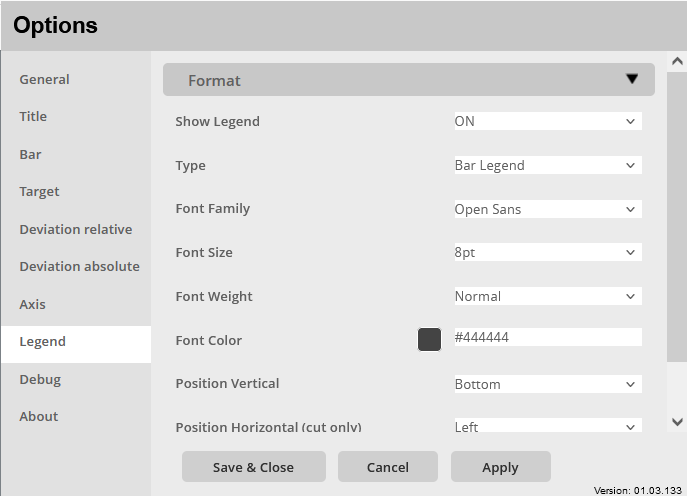
Show Legend:
Activate/deactivate the display of the legend: ON / OFF
Legend Type:
Selection of which type of legend should be displayed:
- Bar Legend
- The legend shows information about the bars. Formatting of the bars and the associated metrics.
- Target Legend
- The legend shows the target legend. Which shows the best case and worst case values for the respective bars.
Font Family:
Setting to set the font family of the legend. There are multiple fonts to choose from, including:
- Arial
- Open Sans
- Segoe UI
Font Size:
Setting the font size for the labeling of the legend, a selection of font sizes is specified:
- 6pt-14pt
Font Weight:
Setting of the font weight for the labeling of the legend.
Choice between:
- Normal
- Bold
Font Color:
Setting to choose the font color of the legend.
Color selection:
- Color menu:
- The color can be selected using buttons.
- The colors of the buttons are predefined and can be customized for the specific company.
- Using the text field in the color menu, additional colors can be added using a hex code.
Position Vertical:
Setting for orientation or setting the main position of the legend:
- Bottom
- The legend is displayed at the bottom of the visualization
- Top
- The legend is displayed above all visualization building blocks, but below the title.
Position Horizontal (cut only):
Setting for the extended positioning of the legend when it is shortened:
- Left
- The abbreviated legend is left-aligned
- Center
- The abbreviated legend is displayed in the middle
- Right
- The abbreviated legend is displayed right-aligned
Cut Off:
Enable/disable legend truncation/trimming: ON / OFF
Company Parameters
The Graph visual provides three configurable company parameters. These parameters allow each company to tailor the visualization to their specific needs. Once configured, these settings will determine the default formatting of the visual every time a new one is created. This ensures consistency and alignment with the company’s preferences and branding guidelines.
The three configurable parameters are:
- Color palette (text, bars, lines, etc.)
- Signal color palette (deviations, waterfall)
- Font palette
How to configure?
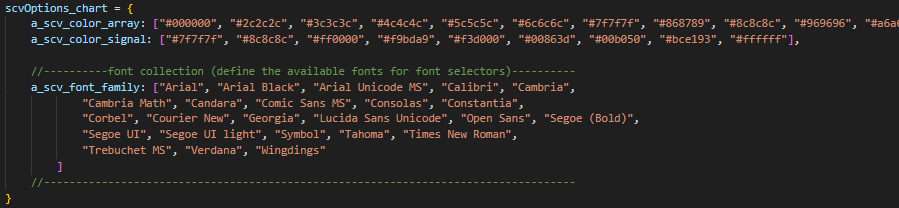
The company parameters can be configured in the configuration file of the visual. This configuration file is located in the visual source folder (…./<visual name>/javascript/). The name of the configuration file is “chartOption.js”
In the top of the file there is an object called “scvOptions_chart”. Within this object there are the 3 paremeters. The name of the parameters are listed below:
|
Parameter
|
Variable Name
|
|---|---|
|
Color palette
|
a_scv_color_array
|
|
Signal color palette
|
a_scv_color_signal
|
|
Font palette
|
a_scv_font_family
|
Parameters
Color Palette
Configuration file: chartOption.js
Object name: scvOptions_chart
Name in the configuration file: a_scv_color_array
This parameter controls which colors are available in the color pickers of the menu. It affects the following areas of the visual:
- Title/Subtitle color
- Bar fill color
- Bar line color
- Bar pattern color
- Bar value font color
- Axis value font color
- Target line color
- Legend title color
- Deviation relative font color
- Deviation relative axis line color
- Deviation absolute line color
- Deviation absolute font color
- Waterfall bar line color
- Waterfall connection line color
- Waterfall middle line color
- Waterfall value font color
- Waterfall total font color
- Waterfall axis line color
- Legend font color
- Red: “#FF0000”
- Green: “#00FF00”
- Blue: “#0000FF”
Signal Color Palette
Configuration file: chartOption.js
Object name: scvOptions_chart
Name in the configuration file: a_scv_color_signal
This parameter controls which colors are available in the color pickers of the menu. It affects the following areas of the visual:
- Deviation relative positive color
- Deviation relative negative color
- Deviation absolute positive color
- Deviation absolute negative color
- Waterfall positive color
- Waterfall negative color
- Red: “#FF0000”
- Green: “#00FF00”
- Blue: “#0000FF”
Font Palette
Configuration file: chartOption.js
Object name: scvOptions_chart
Name in the configuration file: a_scv_font_family
This parameter controls which fonts are available in the font selectors of the menu. It affects the following areas of the visual:
- Title/Subtitle font
- Bar value font
- Target legend font
- Deviation relative value font
- Deviation absolute value font
- Waterfall value font
- Waterfall total value font
- Axis font
- Legend font
- “Arial”,
- “Arial Black”
- “Arial Unicode MS”
- “Calibri”
- “Cambria”
- “Cambria Math”
- “Candara”
- “Comic Sans MS”
- “Consolas”
- “Constantia”,
- “Corbel”
- “Courier New”
- “Georgia”
- “Lucida Sans Unicode”
- “Open Sans”
- “Segoe (Bold)”
- “Segoe UI”
- “Segoe UI light”
- “Symbol”
- “Tahoma”
- “Times New Roman”
- “Trebuchet MS”
- “Verdana”
- “Wingdings”
- etc.