
Documentation - Power BI
Administration Guide
Set Up
Installation
The SCvation visualizations for Power BI can be added as visuals from Power BI AppSource. Learn more about importing a Power BI visual from AppSource here.
1. Open your report in Power BI Desktop or Power BI service.
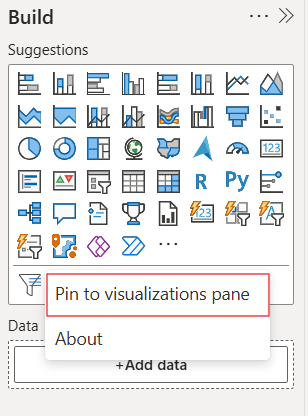
2. Select the ellipsis from the visualizations pane.
3. Select Get more visuals from the menu.

4. Select AppSource visuals and select on the visual you want to import.
5. Select Add to add the visual to your report.
6. When the visual has successfully imported, select OK.
7. The visual now appears as a new icon in the visualizations pane of the current report. Select it to create the visual on the report canvas
8. If you want the visual to remain on the visualization pane for all reports right-click on it and select Pin to visualization pane.
User Guide
Overview
The SCvation visualizations are available for Power BI to visualize the data in the report.
PDF-Export
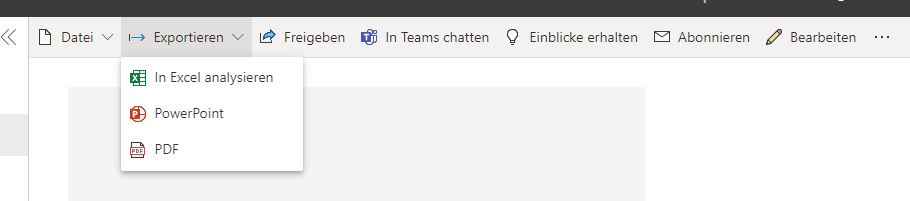
In the view mode of the report containing the visualizations, the report can be exported in PDF format with the SCvation visualizations via
Export > PDF in the top menu bar.
Browser
The SCvation visualizations for PowerBI are available for use in different browsers.
Supported Browser
- Windows operating system (PC)
- Opera (ab Version 38)
- Edge (ab Version 79)
- Firefox (ab Version 54)
- Chrome (ab Version 51)
- iOS operating system
- Safari (ab Version 10)
Not supported Browser
Browsers in which the SCvation visualizations are not supported.
- Internet Explorer
- Also not officially supported by PowerBI