Unlock the potential of your data with the Data Slicer Visual in Power BI, empowering you to seamlessly filter and visualize your data across various visuals within your reports. Effortlessly manage large datasets by entering numerous data elements into the Data Slicer in list format, enabling efficient data filtering.
Experience streamlined data management with our user-friendly interface, facilitating easy data input and filter configuration. Navigate with ease using the “Quick Menu”, designed for intuitive, swift, and stylish operation, ensuring seamless interaction with your data.
Find out about key features of the Data Slicer visual:
Power BI Certified
Certification of our Power BI visuals ensures top-notch security, quality, and performance for our customers. Each visual undergoes rigorous Microsoft reviews for security, code quality, functionality, and compatibility, ensuring they are free from malicious code and perform seamlessly across all Power BI platforms, including web, desktop, and mobile. Certified visuals meet strict performance metrics, efficiently handling large data volumes without compromising overall performance. They also include accessibility features, ensuring usability for individuals with disabilities, and use only approved APIs for flawless integration. Additionally, strict measures prevent unauthorized data exfiltration, safeguarding sensitive information. By choosing our certified visuals, you benefit from secure, reliable, and regulation-compliant tools, enhancing your data analysis capabilities with confidence and peace of mind.
Operation Modes
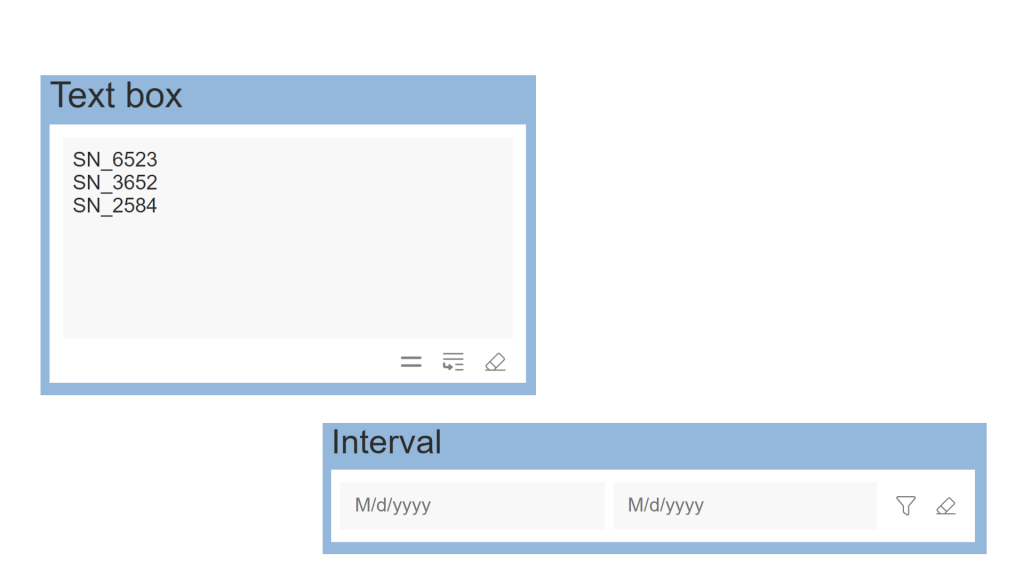
The Data Slicer visual offers multiple operation modes to suit different selection needs. Text box mode allows you to quickly select values in bulk by copying and pasting them into a text field, making it ideal for large datasets. Interval mode, on the other hand, lets you define a range by specifying minimum and maximum values, perfect for selecting continuous data. Whether you need precise filtering or rapid bulk selection, these modes provide the flexibility to work with your data efficiently.
Documentation button
Interval Mode
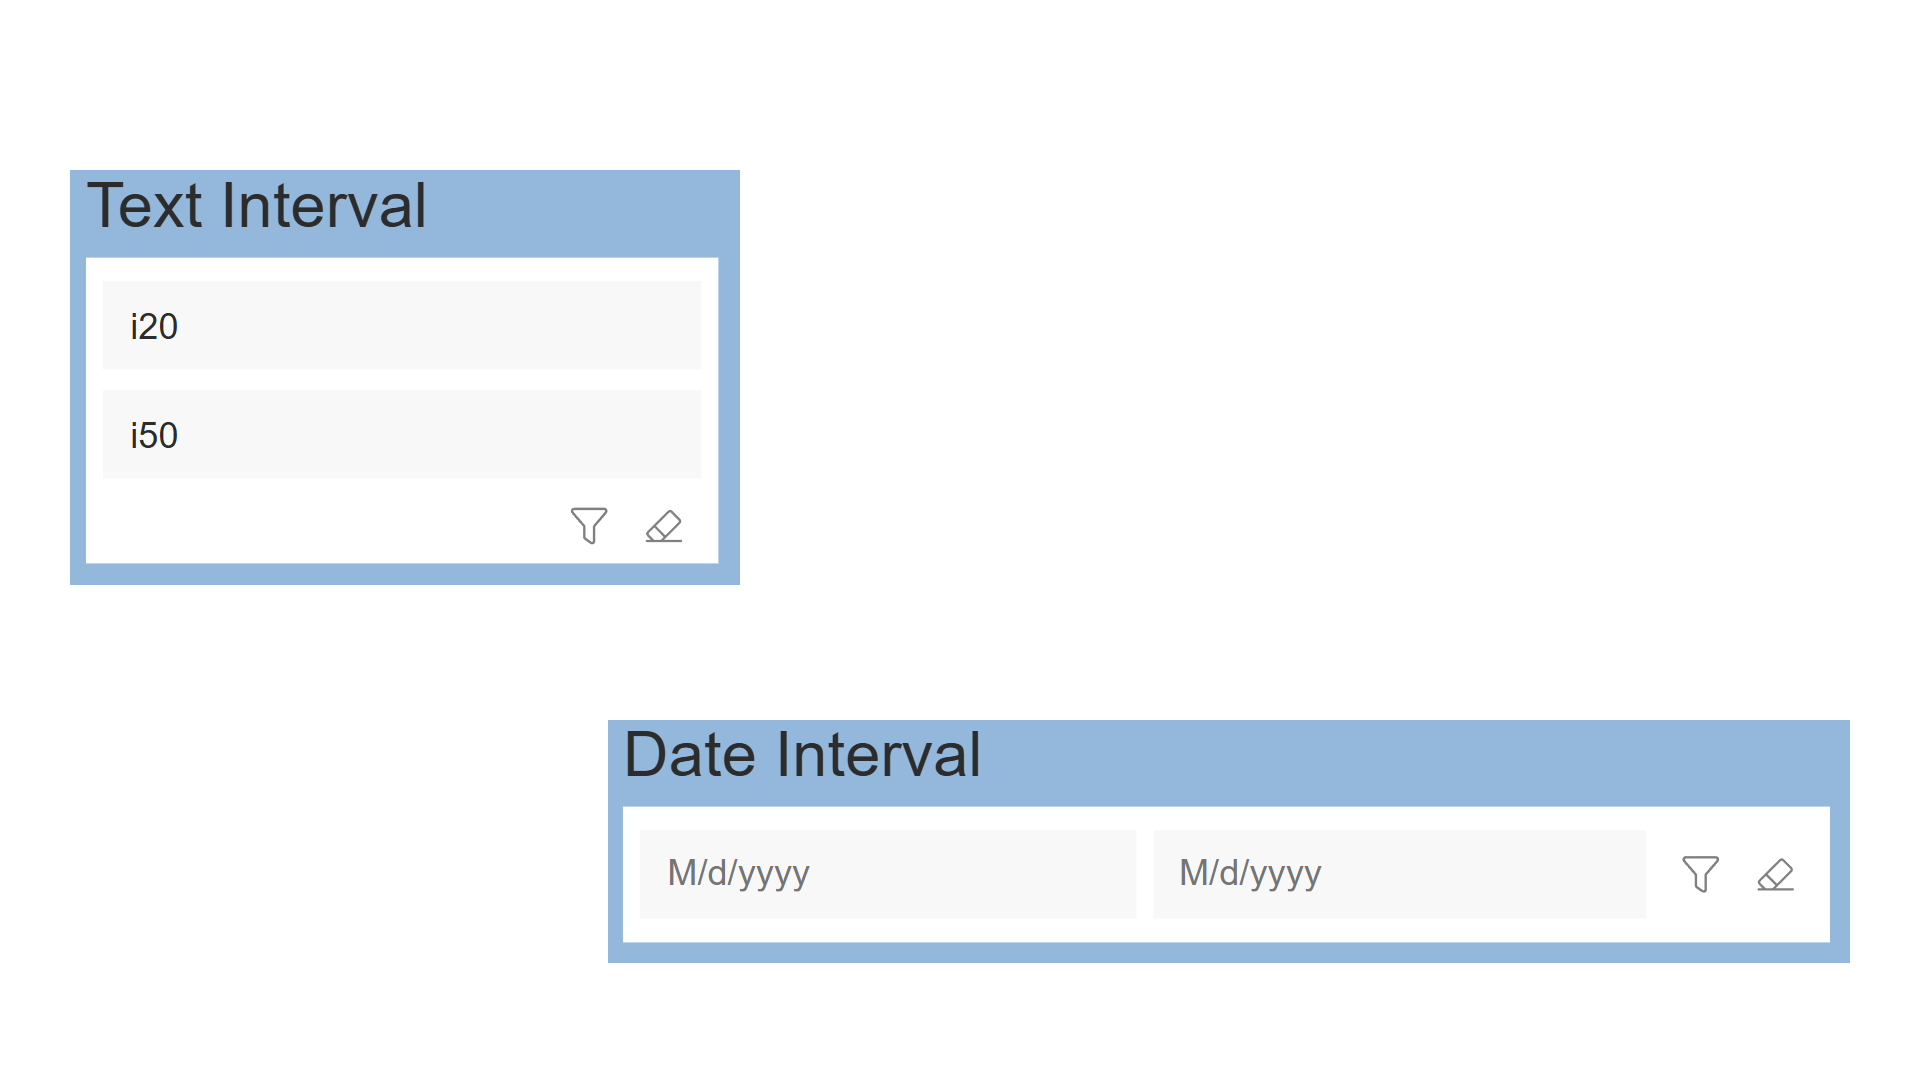
Effortlessly define a data range by specifying minimum and maximum values. This mode supports numeric, date, and text inputs, ensuring flexibility in your selections. Built-in validation guarantees that entries are both valid and in the correct order, with any errors clearly highlighted for easy correction. Select your data intuitively and precisely with Interval Mode.
Documentation button
Bulk insert
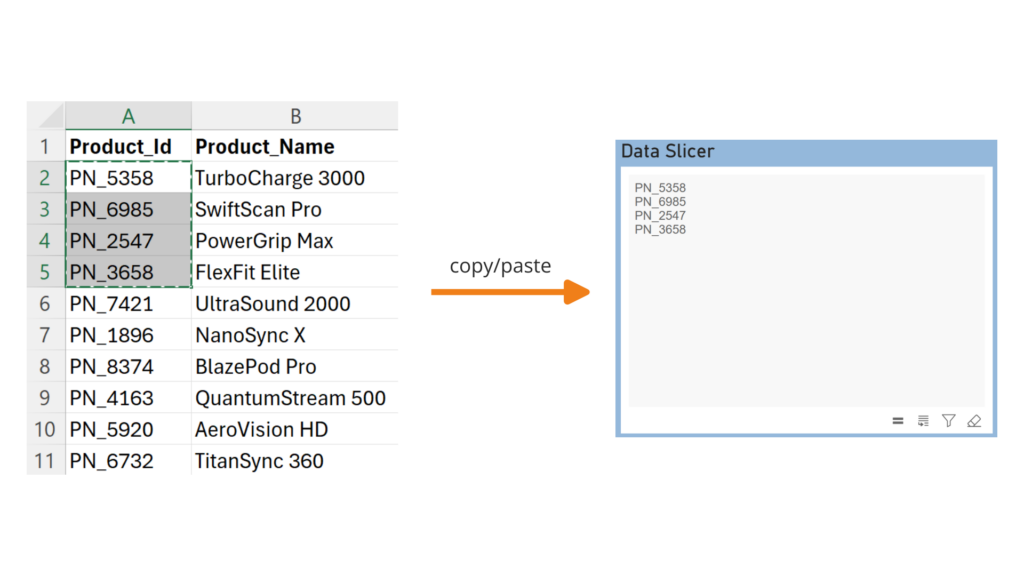
Our application’s intuitive interface ensures effortless data insertion. You can seamlessly import up to 30,000 values from spreadsheet software like Excel or any list format.
With streamlined copy-and-paste functionality, manual entry becomes a thing of the past. Say goodbye to tedious data input and hello to smooth data analysis.
Documentation button
Quick Menu
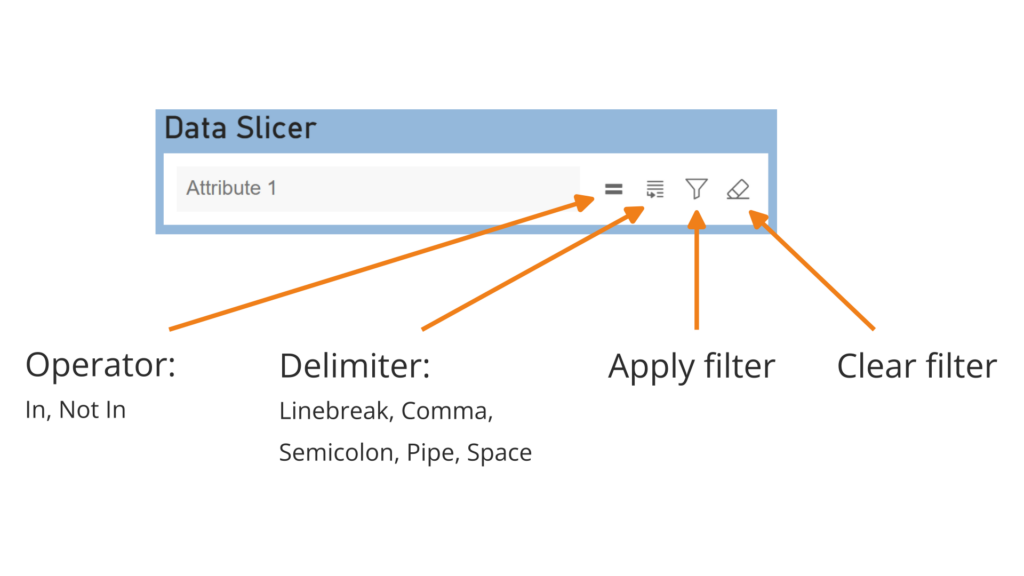
Experience simplicity, speed, and elegance with our “Quick Menu” feature. Designed for effortless operation, it offers intuitive switches for essential functions such as applying filters, clearing filters, setting delimiters, and choosing operators. Whether you’re a seasoned user or a newcomer, navigating through your tasks has never been smoother.
Documentation button
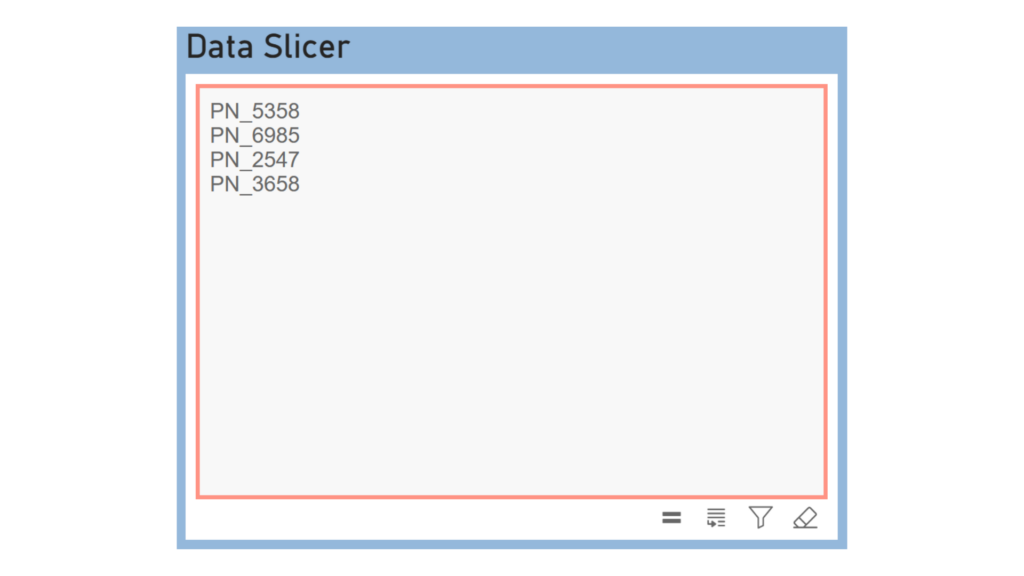
Highlighted Frame
Stay informed and in control with our interactive frame feature, designed to provide clear signals regarding the application of filters. This intuitive element not only indicates whether a filter has been applied but also offers visual feedback to ensure you’re always aware of the current filter status.
Documentation button
Responsive Design
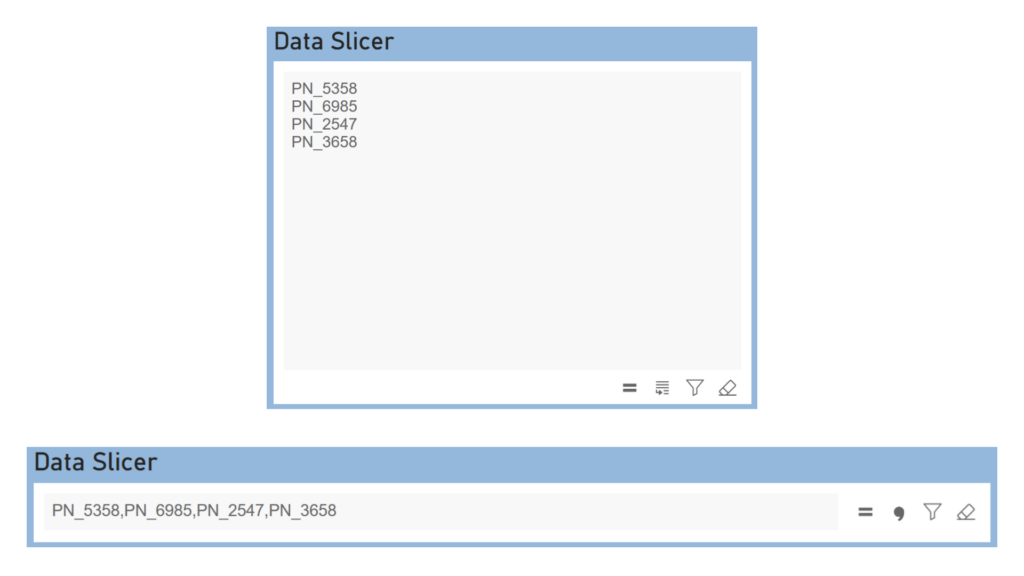
Our responsive design provides an optimal viewing and interaction experience. This approach enhances usability and ensures that the layout adapts seamlessly to the size of the visual display, whether you’re on a smartphone, tablet, or desktop.
Documentation button
Example Dashboard
Additional Features
Filter your report based on a column of data containing up to 30,000 items.
Seamlessly integrate multilingualism into your semantic model, ensuring compatibility with diverse language requirements for enhanced accessibility and global usage.
Achieve synchronized filtering functionality within your report across multiple pages.
Utilize filter operators such as “In” (include) and “Not In” (exclude).
Use various separators including line breaks, spaces, commas, semicolons and pipes for effortless data entry.
Access a wide range of formatting options to seamlessly integrate the visual into your report layout.
Control the timing of data filtering with filter apply logic options “onButton” and “onExit”, providing flexibility in managing the filtering process according to user preferences and workflow requirements.
Trigger data filtering conveniently with the “Ctrl + Enter” shortcut, offering an efficient and intuitive method to initiate filtering actions, optimizing user workflow and productivity.
Documentation button
Documentation
The Data Slicer visual has an extensive online documentation covering all parts of the visual