By analyzing existing processes, we can identify inefficiencies and opportunities for optimization.
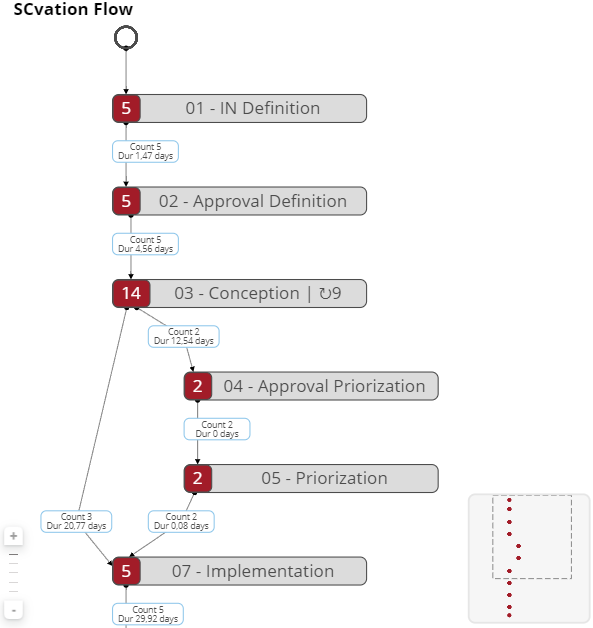
With SCvation Flow Visual, these processes and their developments, along with the timing of events, actions, or activities, can be effectively displayed. Events are arranged in chronological order within the Flow visualization. The tool calculates the number of process instances and the average duration between individual events, presenting these metrics as key figures in the visualization. The frequency of process runs is also depicted by the thickness of the transition lines.
Certification of our Power BI visuals ensures top-notch security, quality, and performance for our customers. Each visual undergoes rigorous Microsoft reviews for security, code quality, functionality, and compatibility, ensuring they are free from malicious code and perform seamlessly across all Power BI platforms, including web, desktop, and mobile. Certified visuals meet strict performance metrics, efficiently handling large data volumes without compromising overall performance. They also include accessibility features, ensuring usability for individuals with disabilities, and use only approved APIs for flawless integration. Additionally, strict measures prevent unauthorized data exfiltration, safeguarding sensitive information. By choosing our certified visuals, you benefit from secure, reliable, and regulation-compliant tools, enhancing your data analysis capabilities with confidence and peace of mind.
Analyze Your Process
With the analysis of existing processes, inefficiencies and potential for optimization can be found in the process. With the SCvation Flow Visual, these processes, process developments and the timing of events, actions or activities can be displayed. The events are arranged in the flow visualization according to the chronological sequence.
The data in the form of event logs is required for the representation of processes and process sequences:
ID/Case/Process Instance
Event/Action/Activity
Timestamp
Documentation button
Minimap
The visualization has a minimap in the lower right corner. This is a miniature view of the events so that you can keep an overview when you enlarge the view by using the mouse wheel. A dashed rectangle on the minimap marks the section of the image that is currently visible. Each dot on the minimap represents an event (start and end event included) from the Flow visualization.
Documentation button
Metrics & Variants Charts
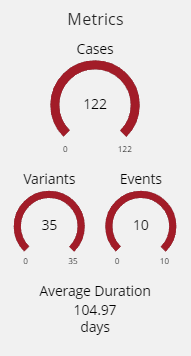
This visualization presents key metrics to analyze your process:
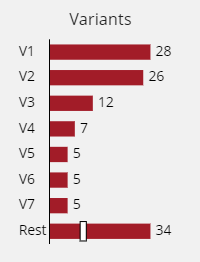
Variant Count: The total number of unique process variants observed.
Case Count: The total number of cases analyzed.
Event Count: The total number of events recorded across all cases.
Average Duration: The average duration of the process from start to finish.
These metrics provide a comprehensive overview of the process performance and variability.
Documentation button
Extensive Menu
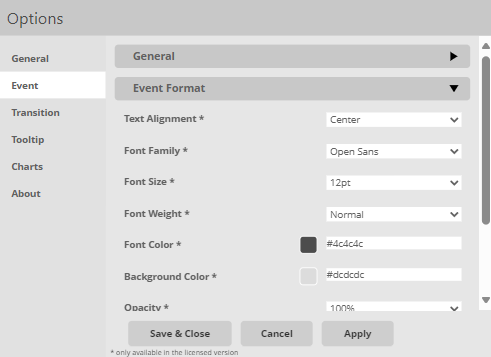
The extensive menu that allows users to fully customize both the style and function of the visualization. Users can select from a variety of colors to enhance visual appeal, and fine-tune text styles for better readability.
Beyond aesthetic adjustments, users can also configure functional aspects such as the duration unit, zoom level, variant and metric charts, tooltips etc., ensuring the visualization is both informative and tailored to your specific analysis needs.
Documentation button
Additional Features
Representation of process flows, interrelated actions
Orientation:
Top to bottom
Bottom to top
Breakdown into events/actions
Interaction with other graphs
Filtering by clicking on the events/actions
Change the level of detail of your process with the zoom level feature
Highlight the main path of your process with a automatic line width
The duration between events is calculated and shown in an Info-Box
Change the size and alignment of the events
Support for Power BI
Support for the entire MicroStrategy platform (MicroStrategy Dossier, MicroStrategy Library, MicroStrategy Mobile)
Documentation button
Detailed documentation on how to use SCvation Flow visualization.