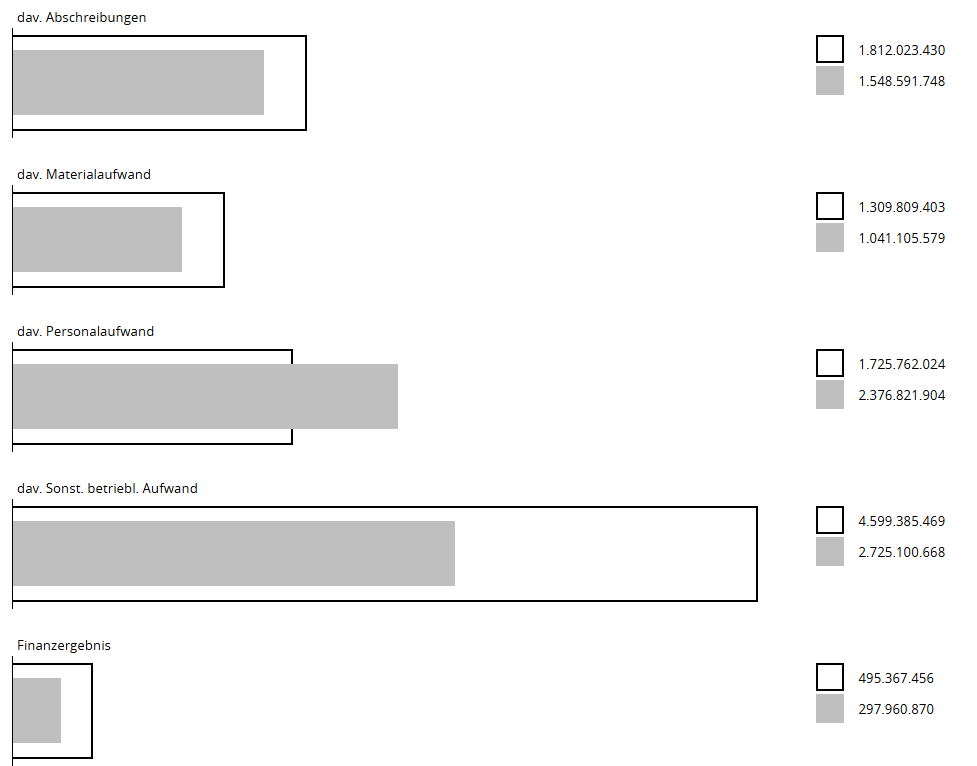
The Fuel Chart adheres to International Business Communication Standards (IBCS) for clarity and consistency. It offers flexible orientation options, scalable bars, and a traffic light indicator for quick performance assessment. These features make the Fuel Chart a versatile and powerful tool for enhancing your reports.
The bars in the Fuel chart can be formatted to adhere to the International Business Communication Standards (IBCS), which aim to enhance clarity and consistency in business reporting. This format standardizes the presentation of incremental changes, ensuring that similar data types are represented consistently across reports. It emphasizes clear labeling, uniform use of colors and symbols, and structured layouts to make data easily understandable and comparable.
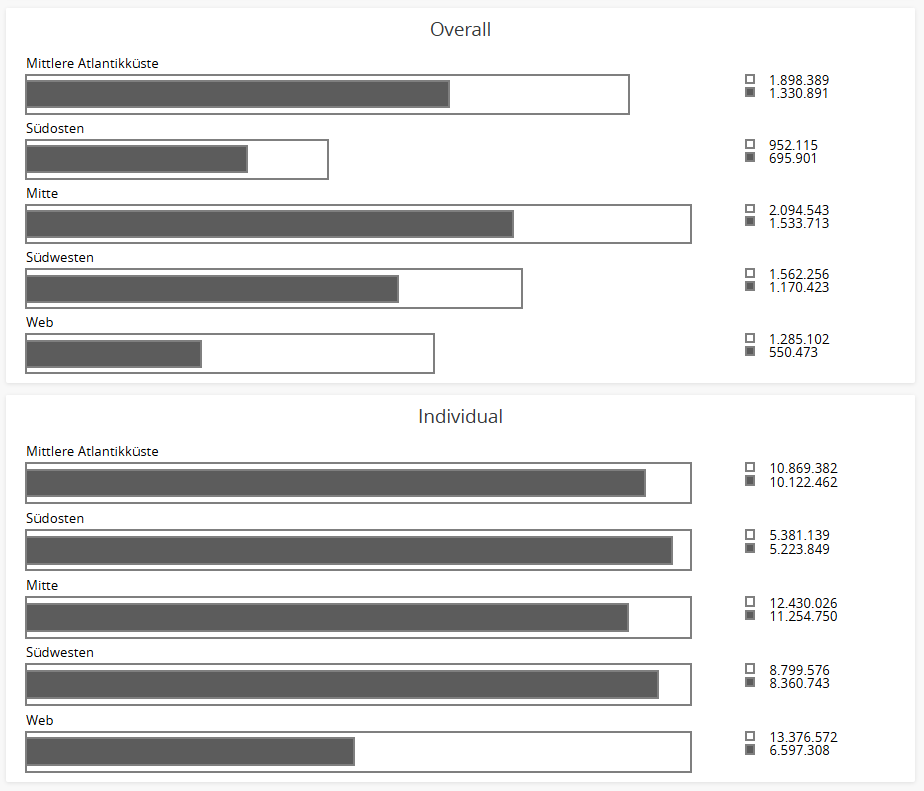
Scaling
The bars in the fuel chart can be scaled either overall or individually. This feature allows for flexible data visualization, enabling users to adjust the scale of all bars collectively or each bar separately. Scaling the bars overall provides a uniform view, making it easier to compare data points at a glance. On the other hand, individual scaling allows for a more detailed examination of specific data points, Athat significant variations are clearly visible and easily interpretable.
Documentation button
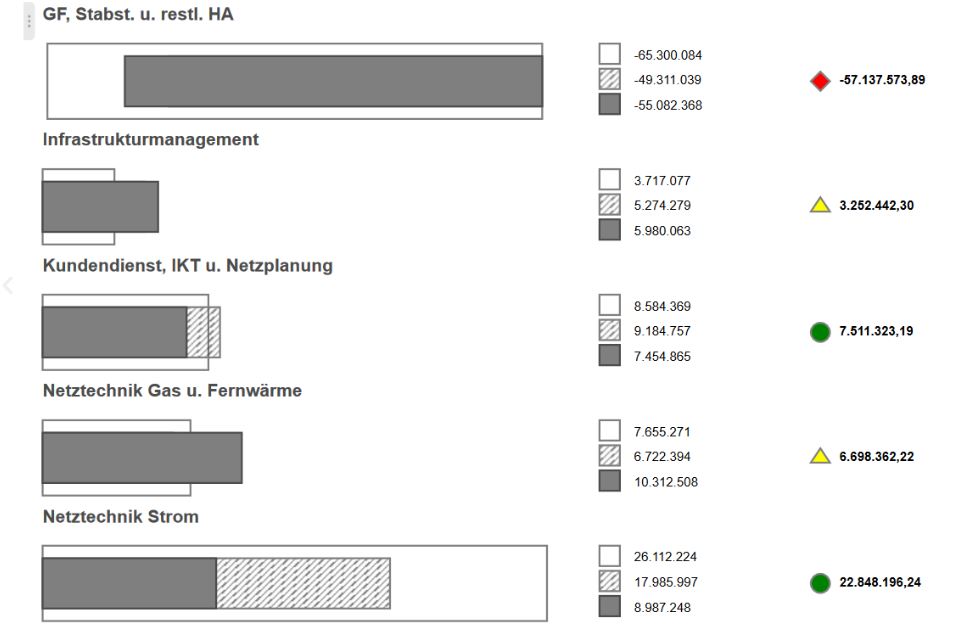
Traffic Light
The traffic light indicator next to the bars in the Fuel chart changes color based on a specific metric. This feature provides a quick visual cue for performance, with colors such as green, yellow, and red representing different levels of the metric. For example, green might indicate optimal performance, yellow could signify caution, and red might highlight areas needing immediate attention. This enhances the chart’s ability to convey important information at a glance, making it easier for users to assess and respond to the data.
Documentation button
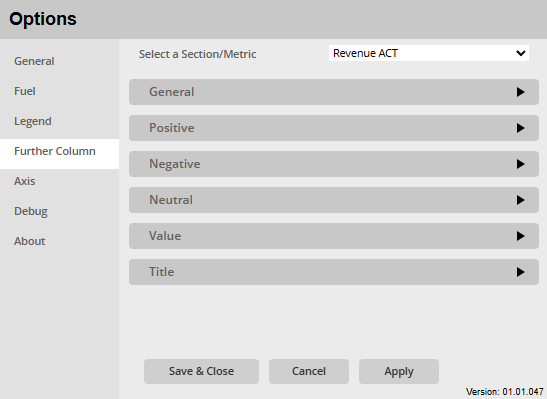
Extensive Menu
The extensive menu that allows users to fully customize both the style and function of the visualization. Users can select from a variety of colors to enhance visual appeal, and fine-tune text styles for better readability.
Beyond aesthetic adjustments, users can also configure functional aspects such as supplementary charts, show totals, only show the top 10 values an summerize the rest in one bar etc., ensuring the visualization is both informative and tailored to your specific analysis needs.