The Gantt chart provides a clear representation of all process sequences, by displaying the start and end dates of each activity.
This visualization allows companies to assess their current processes and identify areas for improvement by analyzing existing workflows. It can display log data, company processes, tickets, tasks, project phases and schedules to monitor ongoing processes, showing the time and duration of each activity, making it easy to pinpoint potential bottlenecks.
Certification of our Power BI visuals ensures top-notch security, quality, and performance for our customers. Each visual undergoes rigorous Microsoft reviews for security, code quality, functionality, and compatibility, ensuring they are free from malicious code and perform seamlessly across all Power BI platforms, including web, desktop, and mobile. Certified visuals meet strict performance metrics, efficiently handling large data volumes without compromising overall performance. They also include accessibility features, ensuring usability for individuals with disabilities, and use only approved APIs for flawless integration. Additionally, strict measures prevent unauthorized data exfiltration, safeguarding sensitive information. By choosing our certified visuals, you benefit from secure, reliable, and regulation-compliant tools, enhancing your data analysis capabilities with confidence and peace of mind.
Visualize Your Process and Process Sequences
The visualization offers extensive formatting options and supports up to millisecond accuracy. This allows for precise tracking of project timelines and task progress, with the ability to customize the appearance of past, current, and future events. Whether you need detailed timing or a clear visual distinction between different stages of your project, this Gantt chart provides the flexibility and precision required for effective project management.
To use the Gantt chart for process flow or project scheduling, the following data is required:
Category/Event/Activity
Parent Category/Project ID
Timestamp (start/end)
Documentation button
Parent Categories and Categories
This visualization supports hierarchical data structures, allowing you to add parent categories and subcategories. This feature enables you to organize tasks under broader project phases or departments, providing a clear and comprehensive view of your project’s structure. By categorizing tasks, you can easily track dependencies, milestones, and overall project progress at multiple levels of detail, ensuring a more organized and insightful project management experience.
Documentation button
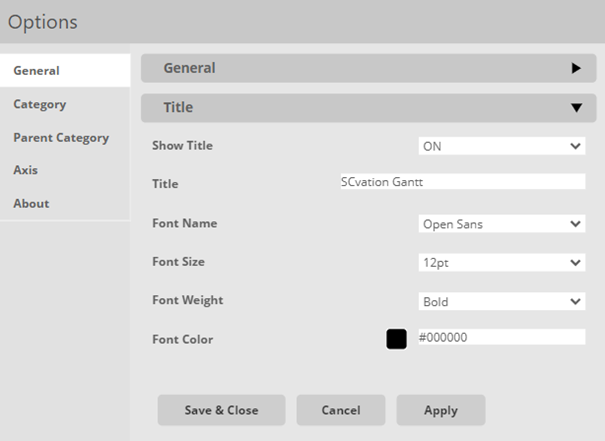
Extensive Menu
The extensive menu that allows users to fully customize both the style and function of the visualization. Users can select from a variety of colors to enhance visual appeal, and fine-tune text styles for better readability.
Beyond aesthetic adjustments, users can also configure functional aspects such as the duration unit, show current timestamp, tooltips etc., ensuring the visualization is both informative and tailored to your specific analysis needs.
Documentation button
Individual Formatting
The visualization offers robust formatting options that allow you to distinguish between past, currently running, and future events. Users can individually customize the appearance of these events, applying different colors and styles to enhance clarity and visual appeal. Past events can be formatted with specific colors to indicate completion, currently running events can be highlighted to draw attention to ongoing activities, and future events can be styled to reflect planned tasks and milestones. These separate formatting options provide a clear and intuitive way to track project timelines and progress at a glance.
Documentation button
Additional Features
Representation of high frequent processes
Extensive menu for customizing the visualization
Interaction with other graphs
Filtering by clicking on the events/parent categories/categories
Support for Power BI
Documentation button
Detailed documentation on how to use SCvation Gantt visualization.