The Stacked Chart Visual enhances business reporting by adhering to IBCS standards, ensuring clear and consistent data presentation. It offers flexible orientation, allowing horizontal or vertical displays to suit different needs. Users can combine stacked and non-stacked bars for a detailed view and calculate deviations between metrics to identify trends and discrepancies. Extensive customization options for colors, text styles, and functional configurations make this visual both informative and tailored to specific analysis needs.
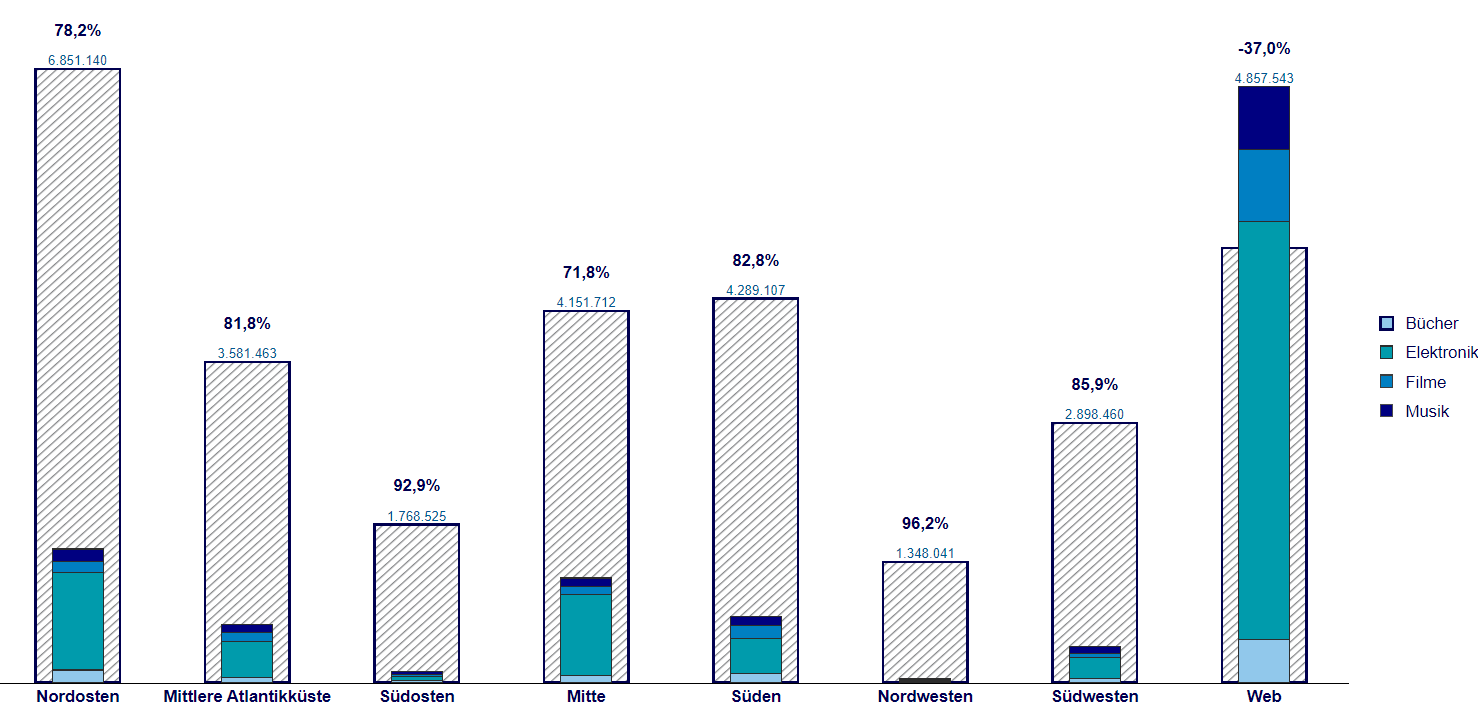
The bars in the Stacked chart can be formatted to adhere to the International Business Communication Standards (IBCS), which aim to enhance clarity and consistency in business reporting. This format standardizes the presentation of incremental changes, ensuring that similar data types are represented consistently across reports. It emphasizes clear labeling, uniform use of colors and symbols, and structured layouts to make data easily understandable and comparable.
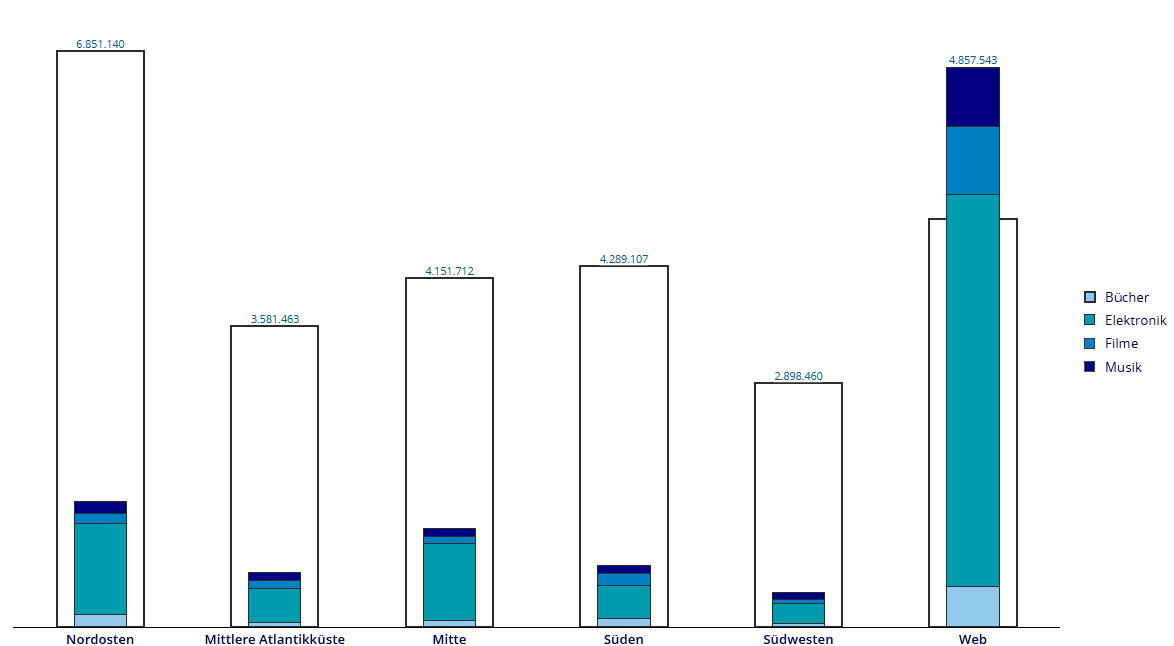
Combine Stacked and Normal Bars
In the Stacked chart visual, you can combine both stacked and non-stacked bars. This feature allows you to decide for each metric whether it should be displayed as a stacked bar or a normal bar. By combining these two types of bars, you can provide a more nuanced and detailed view of the data. Stacked bars are useful for showing the composition of different categories within a total, while non-stacked bars can highlight individual metrics. This flexibility enhances the chart’s ability to convey complex information clearly and effectively.
Documentation button
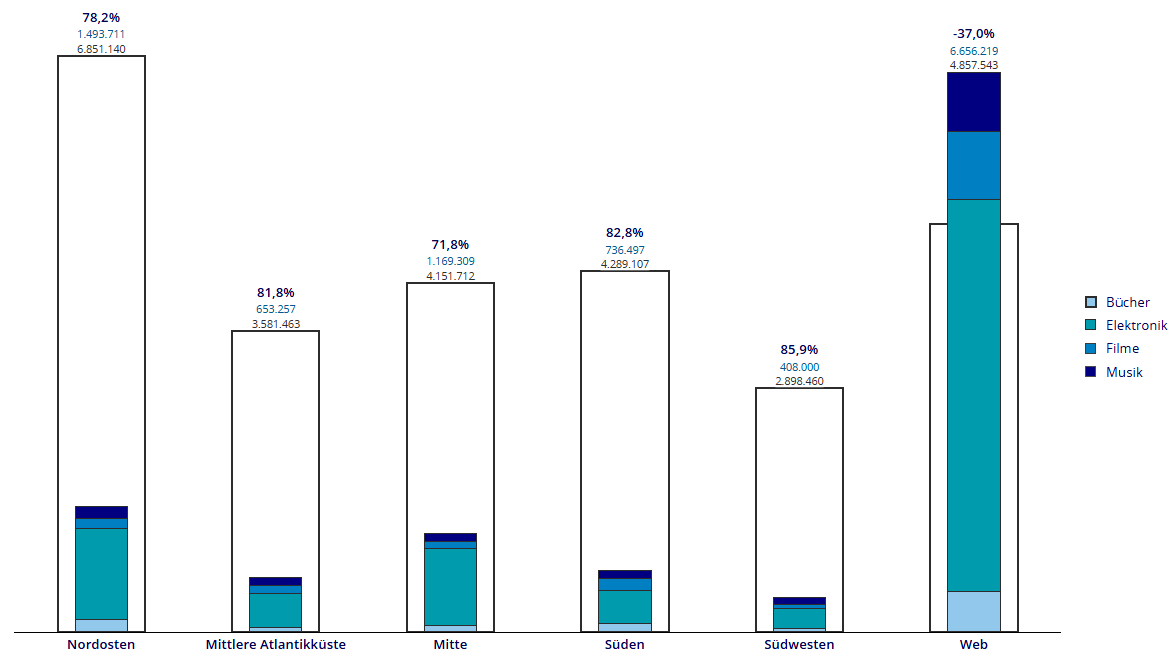
Deviation
The Stacked chart visual allows you to calculate the deviation between two bars from different metrics. This feature enables users to compare values directly and determine the difference between them. By calculating the deviation, you can quickly identify trends, discrepancies, or significant changes between the metrics. This enhances the analytical capabilities of the chart, making it easier to draw meaningful insights from the data.
Documentation button
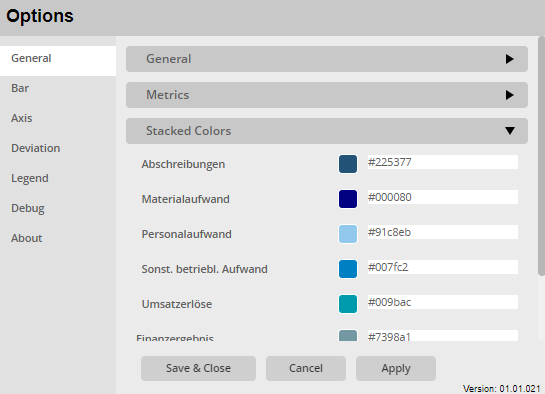
Extensive Menu
The extensive menu allows users to fully customize both the style and function of the visualization. Users can select from a variety of colors to enhance visual appeal, and fine-tune text styles for better readability.
Beyond aesthetic adjustments, users can also configure functional aspects such as display a bar type, show bar values, calculate deviation etc., ensuring the visualization is both informative and tailored to your specific analysis needs.
Documentation button
Additional features
IBCS conform chart
Extensive menu for customizing the visualization
color-editor
number scaling
deviation
legend
Support for the entire MicroStrategy platform (MicroStrategy Dossier, MicroStrategy Library, MicroStrategy Mobile)
Documentation button
Detailed documentation on how to use SCvation Stacked visualization.