The Waterfall chart offers flexible horizontal or vertical orientations, tailored to your data needs. It breaks oversized bars for clarity, displays best and worst-case scenario lines for easy performance evaluation, and provides extensive customization options to suit both style and functionality.
The start and end bar in the Waterfall chart can be formatted to adhere to the International Business Communication Standards (IBCS), which aim to enhance clarity and consistency in business reporting. This format standardizes the presentation of incremental changes, ensuring that similar data types are represented consistently across reports. It emphasizes clear labeling, uniform use of colors and symbols, particularly for increases, decreases, and totals, and structured layouts to make data easily understandable and comparable.
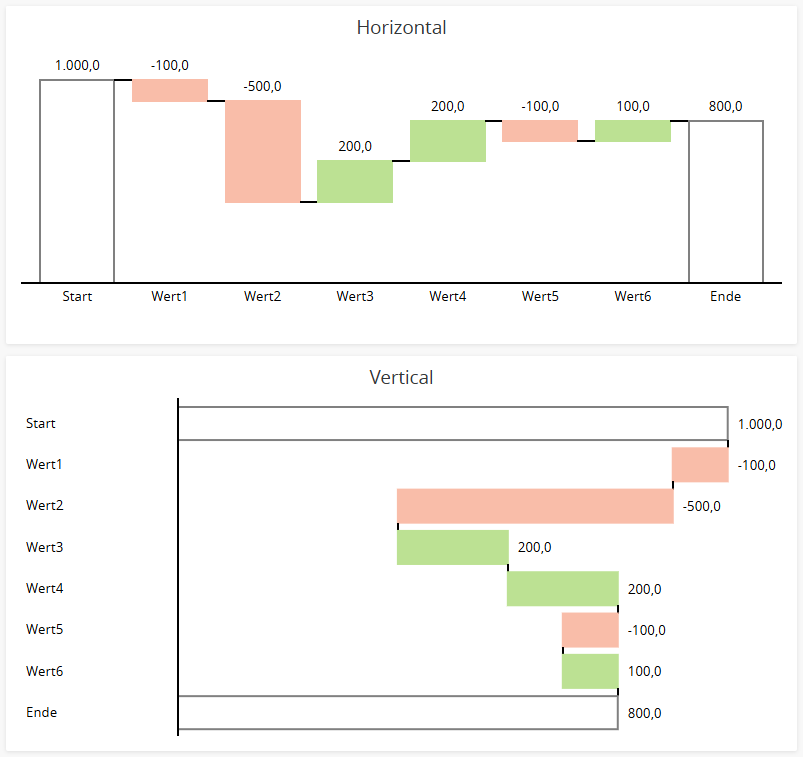
Orientation
The visualization offers extensive formatting options and supports up to millisecond accuracy. This allows for precise tracking of project timelines and task progress, with the ability to customize the appearance of past, current, and future events. Whether you need detailed timing or a clear visual distinction between different stages of your project, this Gantt chart provides the flexibility and precision required for effective project management.
Documentation button
Target Values
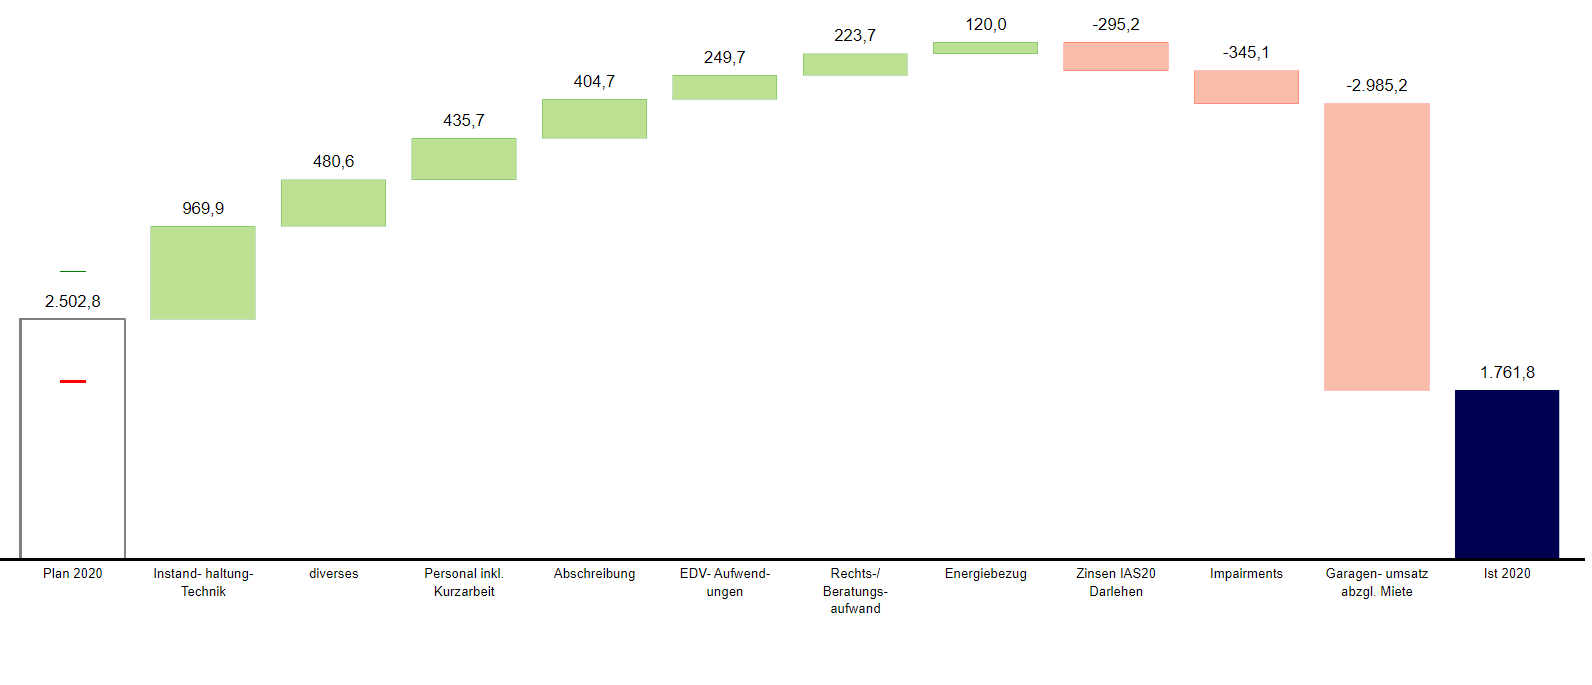
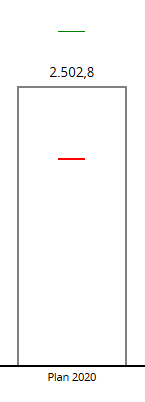
The Waterfall chart allows you to display lines indicating the best case and worst case target values. This feature provides clear visual markers for the optimal and least favorable outcomes, helping users quickly assess how the actual data compares to these targets. By including these lines, the chart enhances the ability to evaluate performance against predefined benchmarks, making it easier to identify areas of success and opportunities for improvement.
Documentation button
Break Start/End Bar
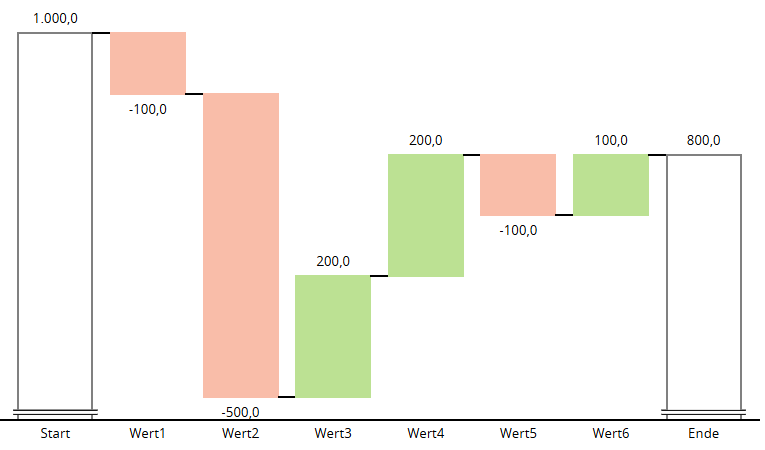
The Waterfall chart allows you to break the start and end bars if they are significantly taller than the rest of the bars. This feature improves readability by preventing extremely tall bars from overshadowing the other data points. By breaking these bars, the chart maintains a balanced and clear visual representation, making it easier for users to interpret and compare the data.
Documentation button
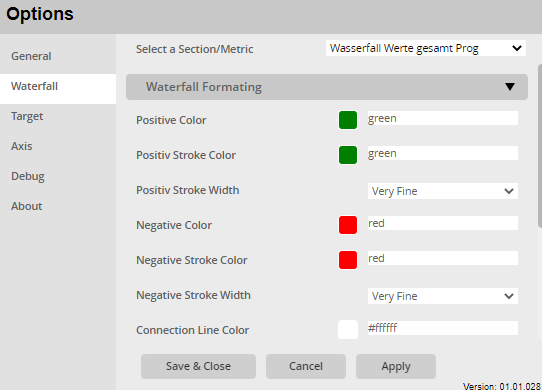
Extensive Menu
The extensive menu allows users to fully customize both the style and function of the visualization. Users can select from a variety of colors to enhance visual appeal, and fine-tune text styles for better readability.
Beyond aesthetic adjustments, users can also configure functional aspects such as display target values, break bars for better readability etc., ensuring the visualization is both informative and tailored to your specific analysis needs.
Documentation button
Additional features
IBCS compliant Waterfall chart
Turn metrics and attributes on/off
Order by Metrics
Individual formatting (font, legend, color editor, …)
Vertical and horizontal chart orientation
Color editor and change of display based on conditions
Powerful menu to customize graph formatting
Support for the entire MicroStrategy platform (MicroStrategy Dossier, MicroStrategy Library, MicroStrategy Mobile, etc.)
Documentation button
Detailed documentation on how to use SCvation Waterfall visualization.