
Power BI Certified
Data Slicer
Report filtering made fast and easy.
Data Slicer empowers report consumers to copy up to 30,000 text and unlimited time and number values directly from Excel into Power BI dashboards; or just set dynamic ranges on the fly.
No complex setups. No scrolling dropdowns.
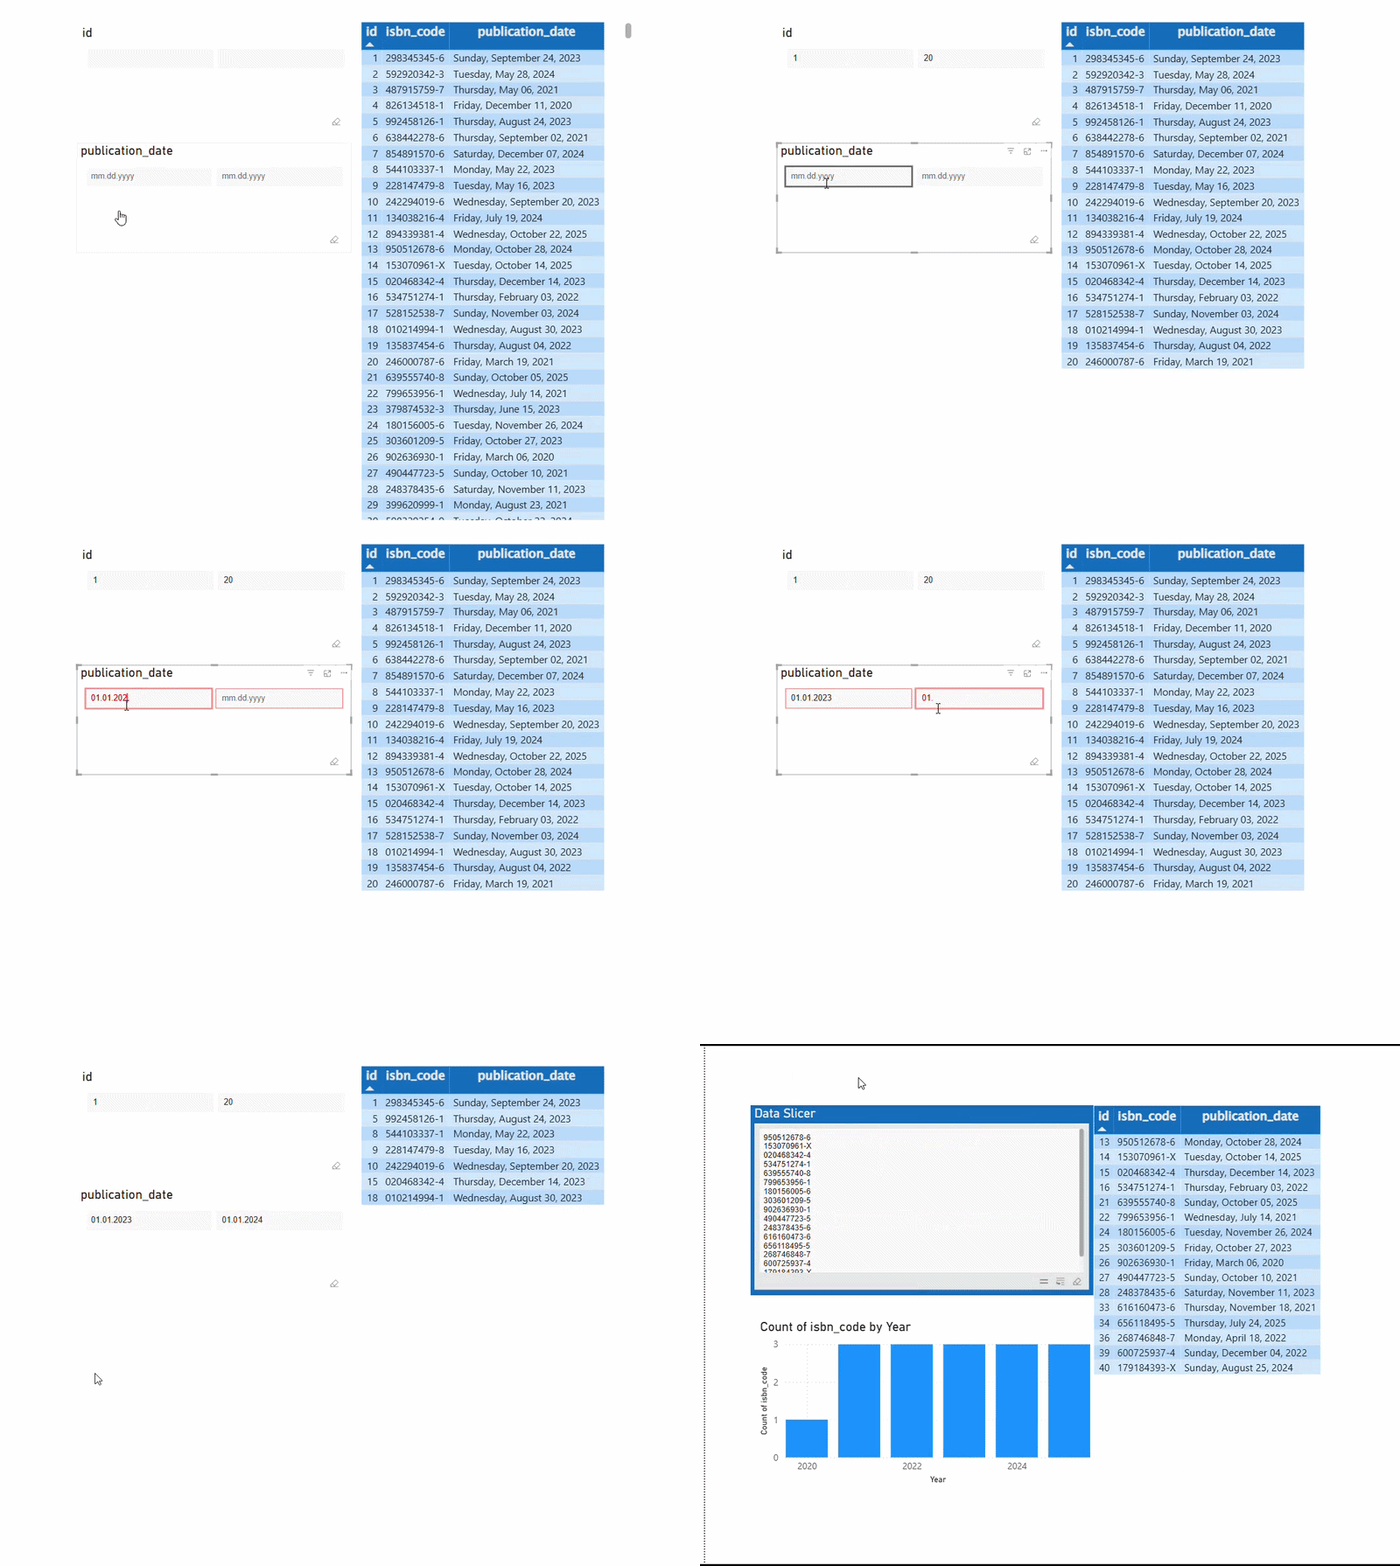
Two operation modes.
One seamless filter.
Whether you’re pasting thousand-row lists from Excel or isolating specific date and numerical boundaries, Data Slicer adapts to your analytical workflow.
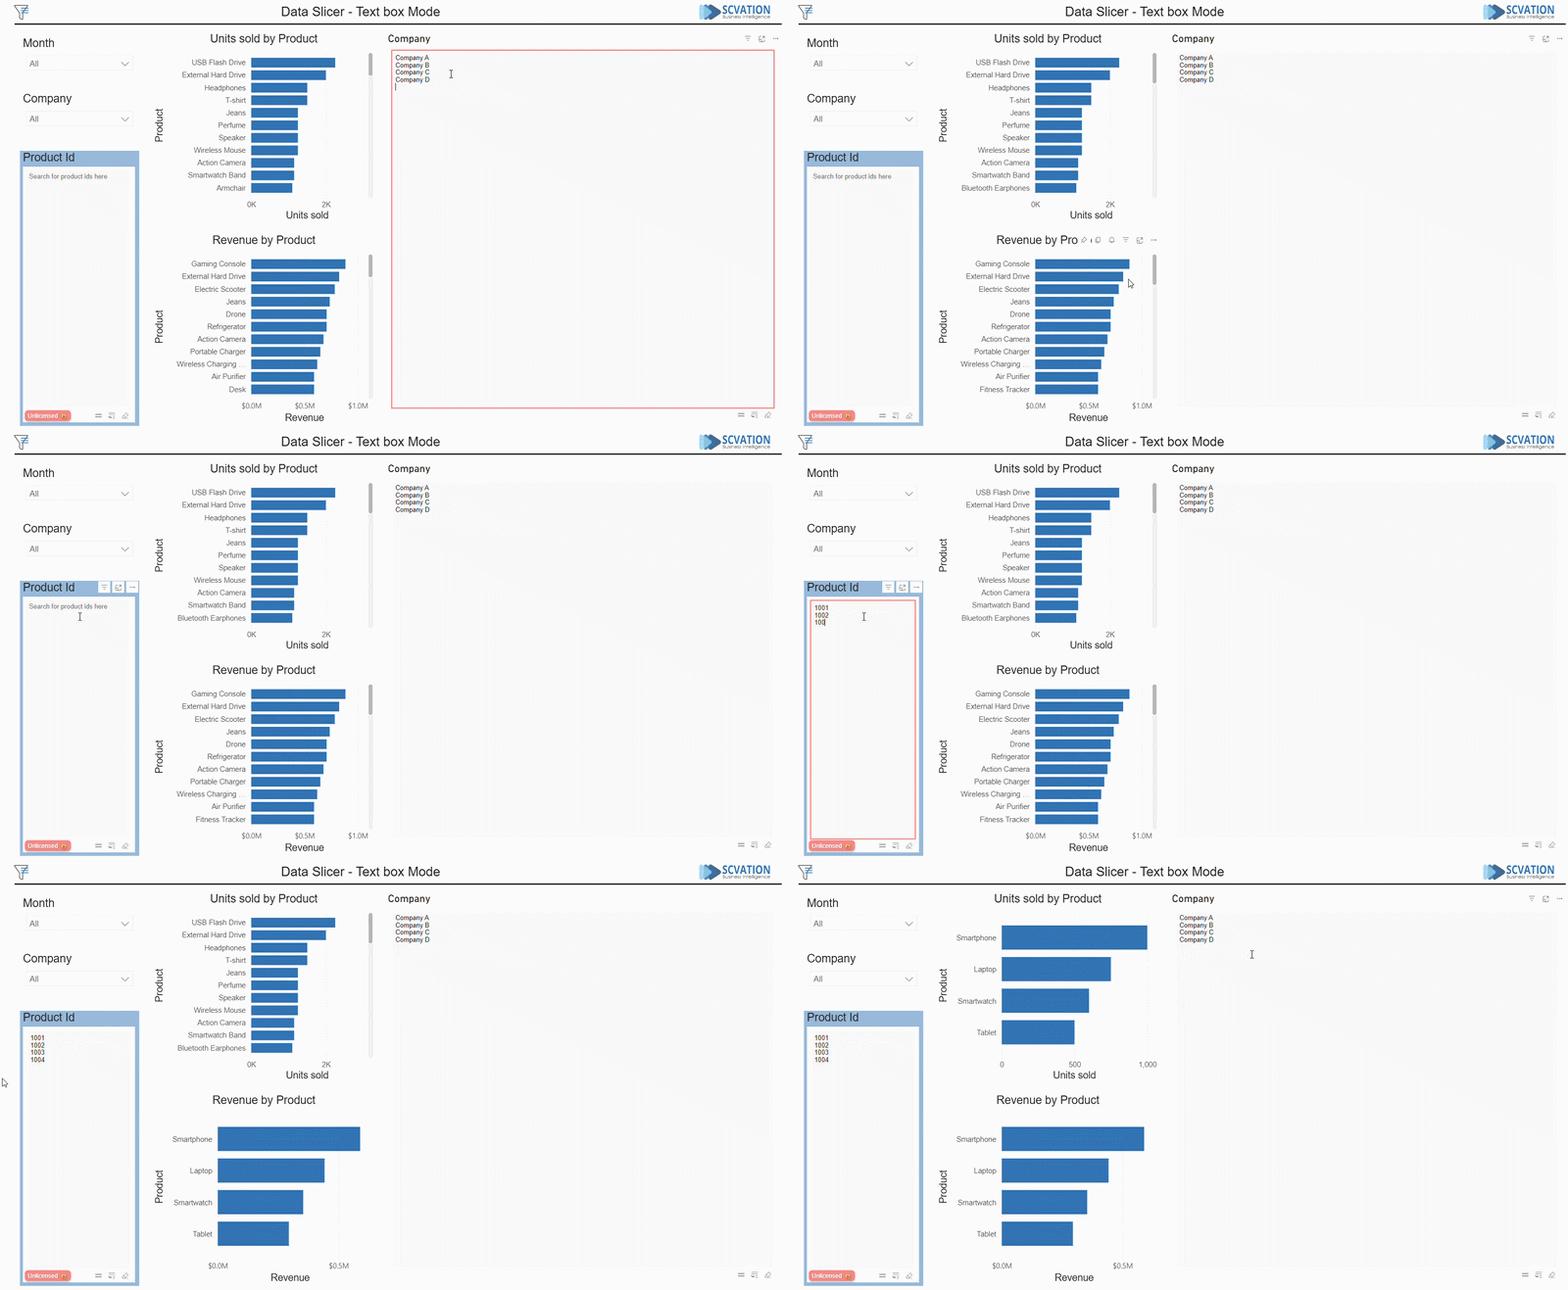
Built for direct searching and large-scale copy-pasting. Easily insert thousands of identifiers from spreadsheets, emails, or internal databases into your report in seconds.
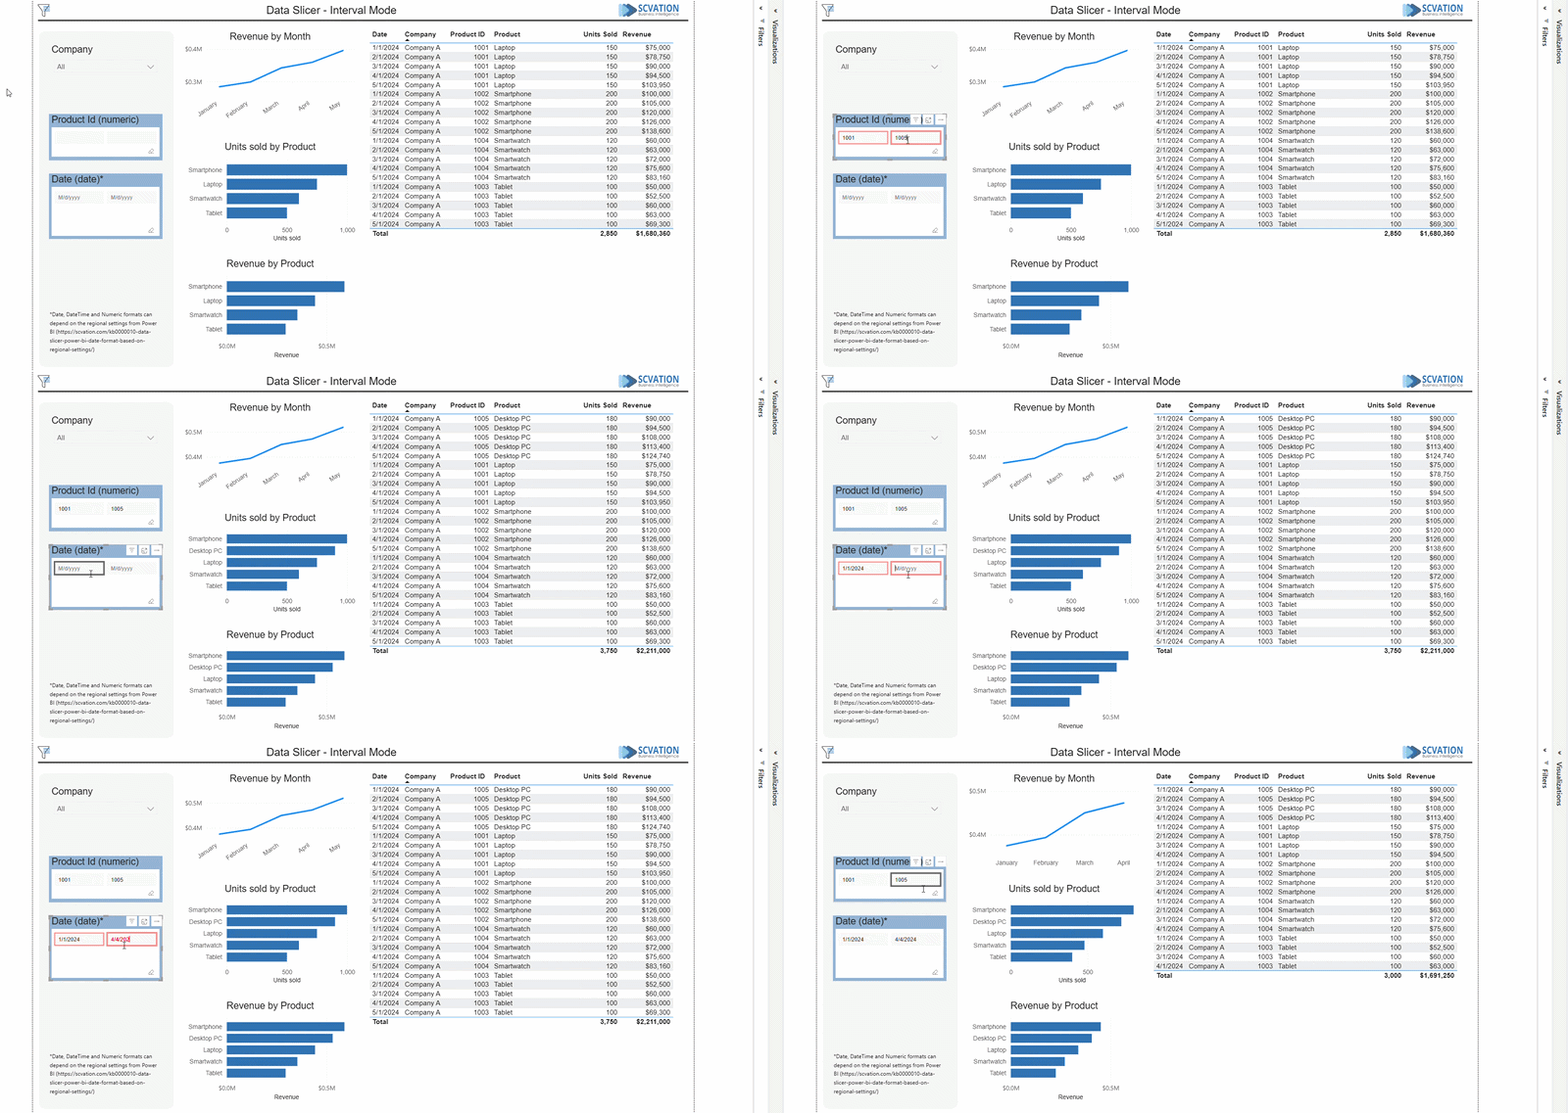
Designed for precise boundary filtering. Define explicit minimum and maximum parameters without relying on tricky native sliders or multi-step dropdown menus.
Try it yourself
Try Data Slicer
Goodbye tedious data input, hello smooth data analysis.
Bulk Insert
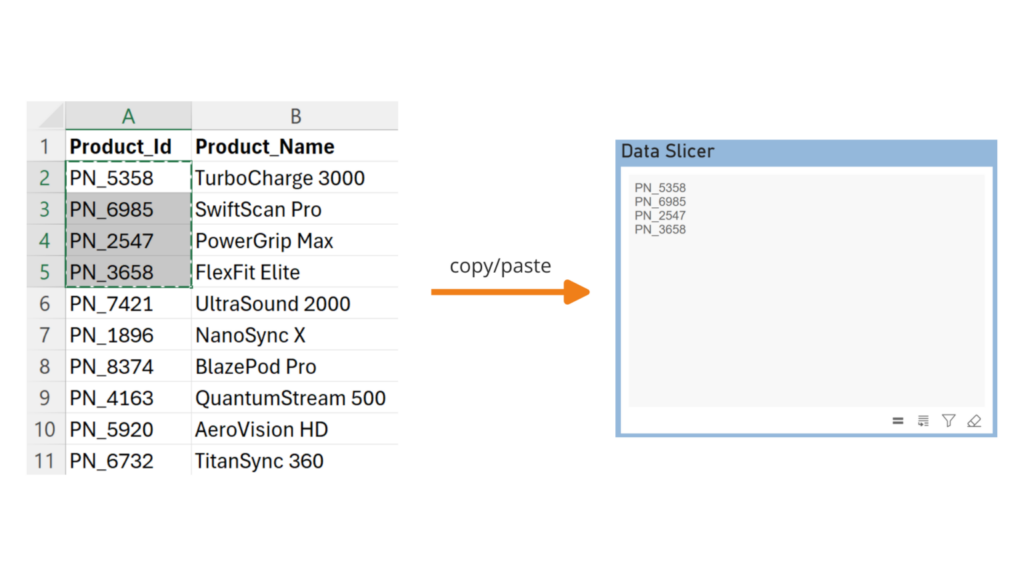
You can seamlessly import up to 30,000 values from spreadsheet services like Excel or any list format.
With streamlined copy-and-paste functionality, manual entry becomes a thing of the past.
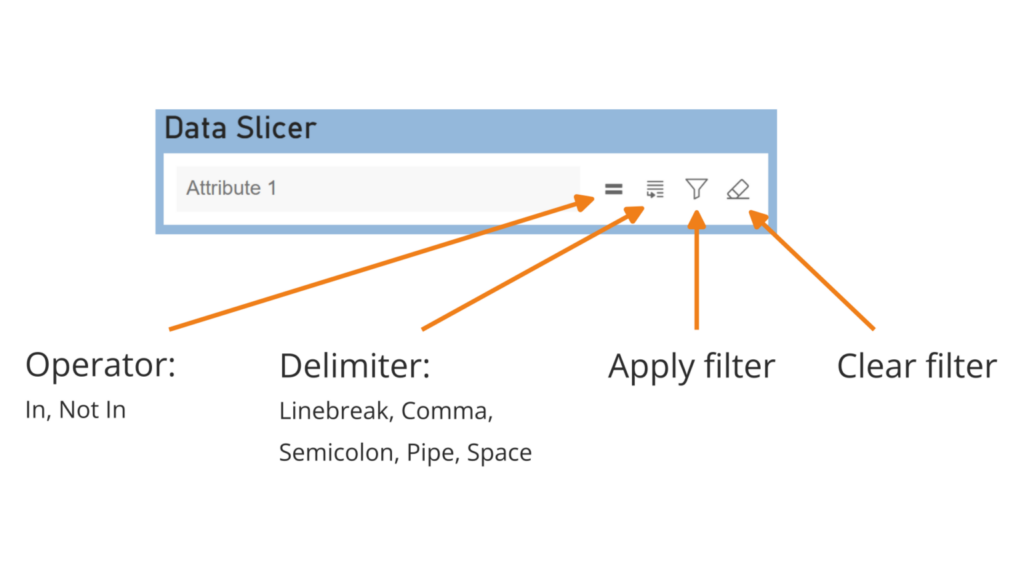
Quick Menu
Designed for effortless operation, it offers intuitive switches for essential functions such as applying filters, clearing filters, setting delimiters, and choosing operators.
Navigating through your tasks has never been smoother.
Highlighted Frame
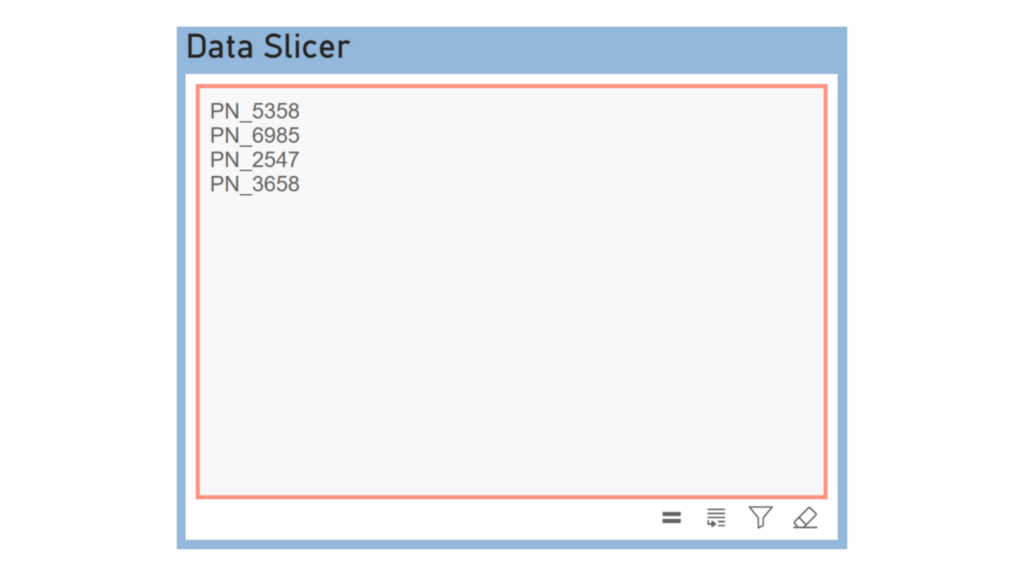
Stay informed and in control with our interactive frame feature, designed to provide clear signals regarding the application of filters.
This intuitive element offers visual feedback to ensure you’re always aware of the current filter status.
Extended Formatting Settings
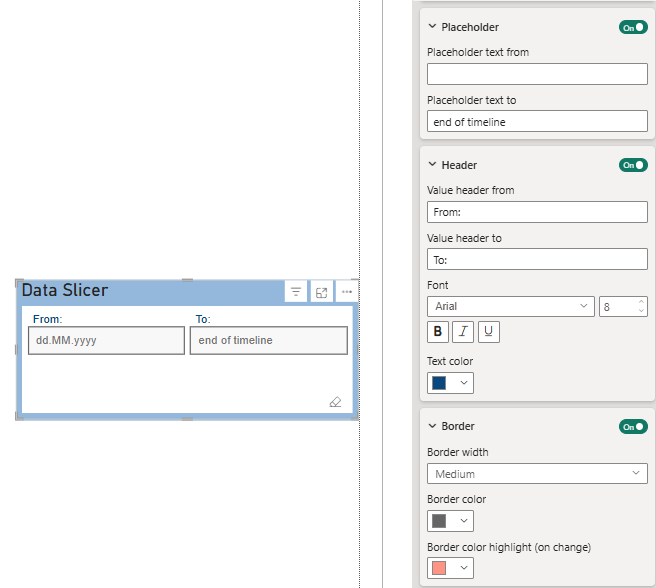
Tailor the slicer’s look to perfectly match your report’s design. Easily adjust layout settings, custom fonts, text colors, and background styling with intuitive controls.
From setting error text colors to customizing placeholder text, headers, and borders, full visual control is just a click away.
See it in action
Watch. Then decide.
Understand why teams choose Data Slicer for their reports
Bring your own dataset. We’ll walk through your process live and answer every question your team has.
Built for precision
Smart designs for smart workflows.
The features that don’t make the headline — but make the difference when it matters.
Input-Output Masks
FLEXIBILITY
Choose how you see formats for dates, without needing to change data anywhere – Data Slicer supports multiple variations while ensuring no format conflicts occur.
Seamless Integration
Robustness
Data Slicer interacts with other visuals in existing reports. It also supports page-wide changes and works seamlessly with bookmarks and navigation buttons.
Power BI Certified
Trust
Microsoft-reviewed code. No external calls, no data leakage. Meets enterprise security standards right out of the box.
Features
Everything the process needs, none of the clutter.
Flexible delimiters
Choose from a wide variety of supported delimiters when slicing between values in textbox mode.
Include / exclude logic
Toggle instantly between “In” (show only these items) and “Not In” (exclude these items) to handle complex filter requirements.
Keyboard shortcuts
Prevent unintentional report lag on large lists. Trigger a refresh on demand with the Apply Filter icon or Ctrl + Enter.
Smart date parsing
Input masks keep typed or pasted date values properly formatted, even across multilingual semantic models.
Multi-type range filtering
Define strict numeric ranges, date and time windows, or alphabetical text boundaries — all with equal ease.
Dedicated min / max fields
Set explicit upper and lower bounds using clean, direct input fields for accurate thresholding.
Responsive design
Responsive design ensures an optimal experience across smartphones, tablets, and desktops.
Report-wide filtering
Achieve synchronized filtering functionality within your report across multiple pages.
Multilingual support
Seamlessly integrate multilingualism into your semantic model, ensuring compatibility with diverse language requirements for enhanced accessibility and global usage.
free to try, licensed to scale
Test the real visual before you buy it.
free
Evaluate
Download from Microsoft AppSource and try Data Slicer on your own dashboard. Core functionality is available; a watermark and data limits apply.
AppSource Plan
Subscribe
Purchase a plan on AppSource and assign licenses to users via the Microsoft 365 Admin Center. Restrictions lift for licensed users.
Custom License
Enterprise
Enterprise & Trust
Built for teams that
can't afford surprises.
Every detail of the licensing and security model was designed for organizations where failure is not an option.
Viewer-inclusive licensing
The license key is tied to the visual instance — every viewer gets full access, not just the report builder. No per-seat counting.
Offline activation
No internet connection required to validate a custom license key. Airgapped environments fully supported.
Power BI Certified
Microsoft-reviewed code with no external calls, no data leakage, and full compliance with enterprise security standards.
Have a lot of users?
Let's build something
specific for you.
Volume licensing, custom deployment, and dedicated onboarding — tailored for the scale your organization needs.
- Volume licensing with unlimited viewers
- Custom license key deployment
- Offline and airgapped activation
- Priority support and onboarding
- Custom reporting templates available
- Power BI Certified — no security exceptions needed
related visuals
Pair it with the rest of the set.
Process Flow
See the path your process actually takes, with automatic variant detection.
Complex filtering made effortless.
Try it now, or talk to us about the metric you check most often.
