The Table Visual enhances data clarity with IBCS-compliant formatting and allows grouping of columns into up to five sections for better analysis. Key features include displaying values as microcharts, applying threshold-based color coding, and customizing row backgrounds based on hidden attributes. These tools make trend identification and data comparison both quick and intuitive.
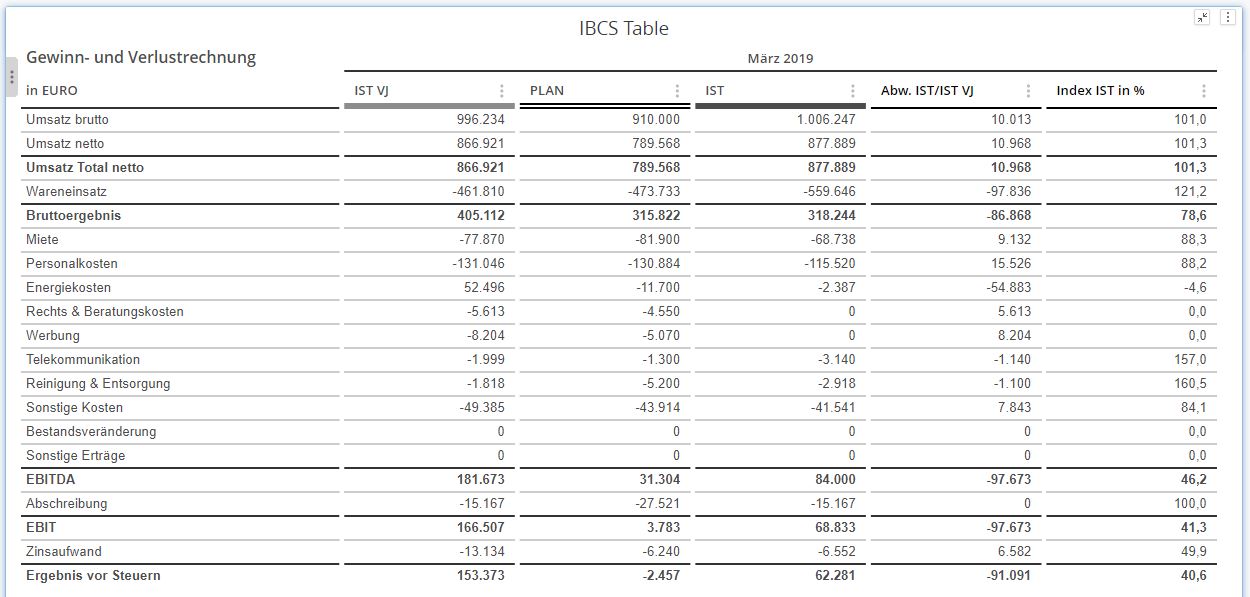
The Column Headers of the table visual can be formatted to adhere to the International Business Communication Standards (IBCS), which aim to enhance clarity and consistency in business reporting. This format standardizes the presentation of data, ensuring that similar data types are represented consistently across reports. It emphasizes clear labeling, uniform use of colors and symbols, and structured layouts to make data easily understandable and comparable.
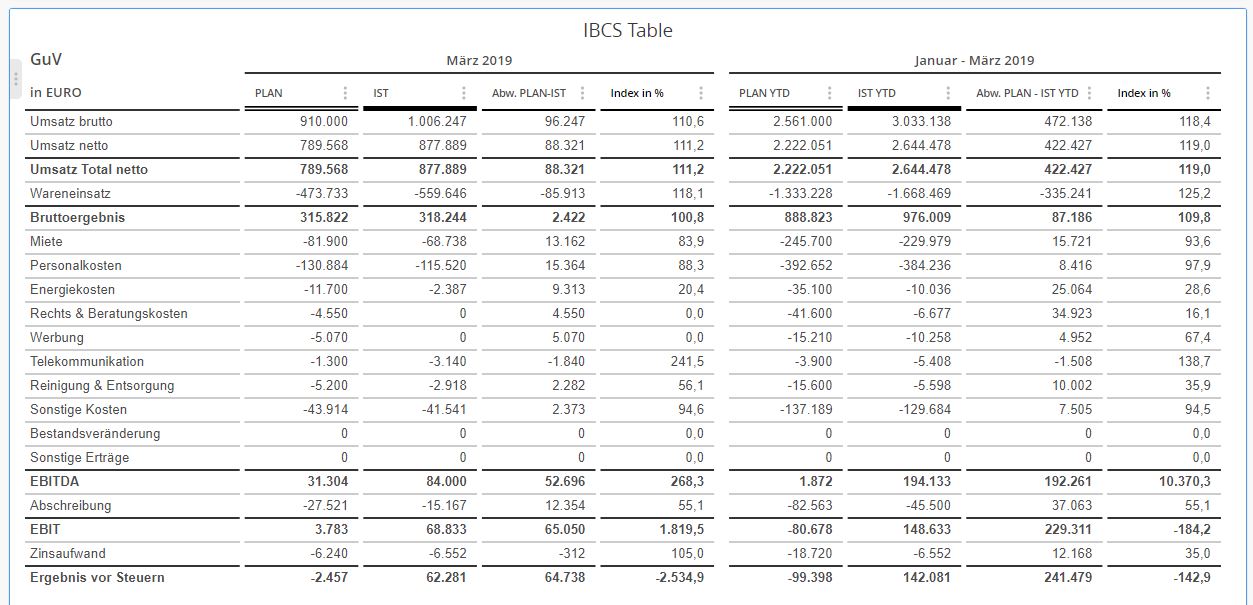
Group in Sections
The Table visual allows you to group columns into up to five sections. This feature enables you to organize data efficiently, such as creating separate sections for each quarter of the year. By grouping columns, you can enhance the readability and analysis of your data, making it easier to compare and interpret information across different time periods or categories.
Documentation button
Microcharts
Users can choose to display column values as microcharts, such as Bar, Needle, or Traffic Light charts. This feature provides a quick and intuitive way to visualize data, making it simpler to identify trends, compare values, and evaluate performance at a glance.
Documentation button
Bild7-1.jpg
Bild8-1.jpg
Bild9-1.jpg
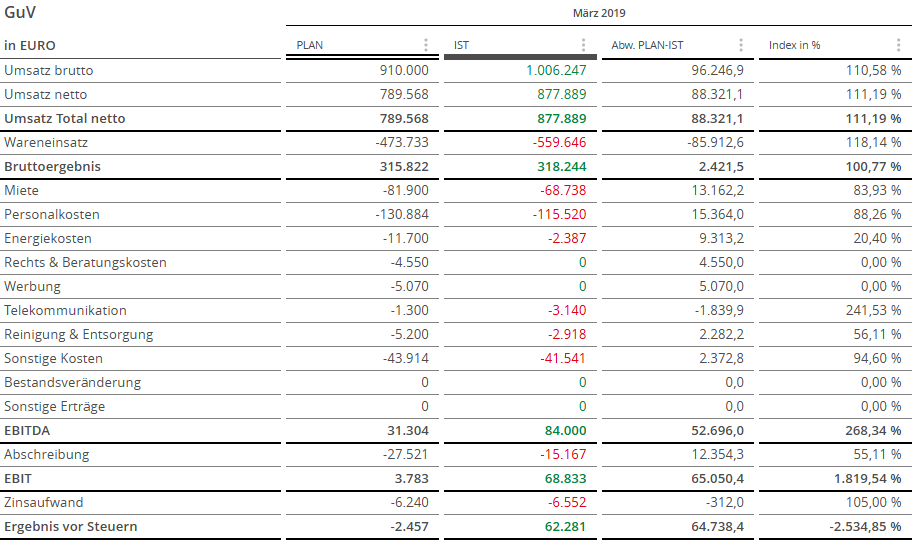
Data Driven Formatting
Users can set two threshold values to color the values of a column in the Table visual. This feature helps to highlight important data points by applying different colors based on the defined thresholds, making it easier to quickly identify and interpret key information.
Documentation button
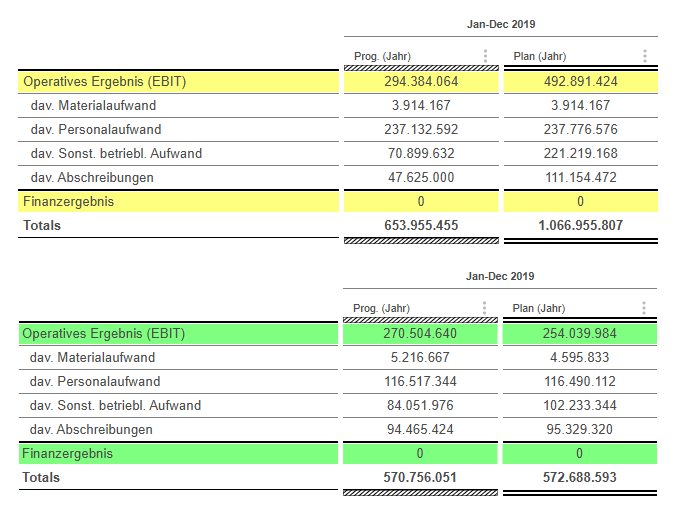
Viariable Formatting
Another useful feature lets users set the background color of a row based on the value of a different attribute that isn’t displayed in the Table visual. This helps to visually differentiate rows according to specific criteria, enhancing the ability to quickly identify and analyze relevant data.
Documentation button
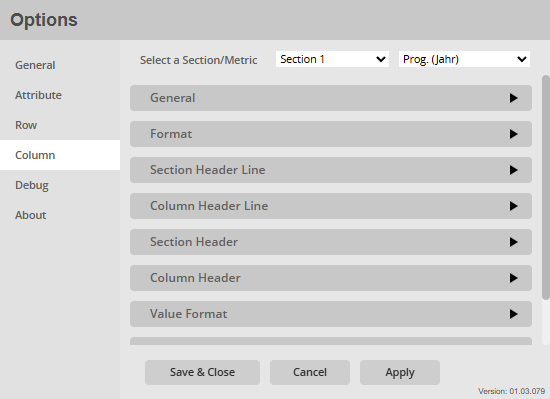
Extensive Menu
The extensive menu allows users to fully customize both the style and function of the visualization. Users can select from a variety of colors to enhance visual appeal, and fine-tune text styles for better readability.
Beyond aesthetic adjustments, users can also configure functional aspects such as microcharts, show totals, only show the top 10 values an summerize the rest in one row etc., ensuring the visualization is both informative and tailored to your specific analysis needs.
Documentation button
Additional features
IBCS conform tables
IBCS conform column format (line style)
Powerful menu, a lot of Options to set up the visualization in an optimal way
Microcharts (Bar, Needle, Traffic light)
Grouping metric in separated sections (actual month, YTD, previous year,…)
Dynamic headline per grouping (z.B. January – April 2021)
Data driven row based formatting (font, line, totals)