Certification of our Power BI visuals ensures top-notch security, quality, and performance for our customers. Each visual undergoes rigorous Microsoft reviews for security, code quality, functionality, and compatibility, ensuring they are free from malicious code and perform seamlessly across all Power BI platforms, including web, desktop, and mobile. Certified visuals meet strict performance metrics, efficiently handling large data volumes without compromising overall performance. They also include accessibility features, ensuring usability for individuals with disabilities, and use only approved APIs for flawless integration. Additionally, strict measures prevent unauthorized data exfiltration, safeguarding sensitive information. By choosing our certified visuals, you benefit from secure, reliable, and regulation-compliant tools, enhancing your data analysis capabilities with confidence and peace of mind.
IBCS
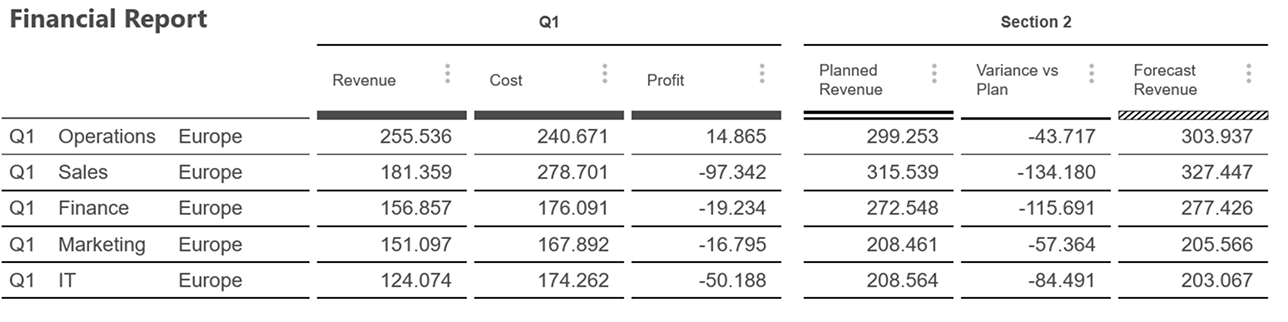
Standardize your business communication with built-in IBCS compliance. The Smart Table eliminates the guesswork in financial reporting by automatically detecting data categories like Actual (AC), Plan (PL), Previous Year (PY), and Forecast (FC). It instantly applies the standardized visual language—including specific line patterns, fill styles, and semantic colors—ensuring your reports are consistent, professional, and instantly understandable across your entire organization.
Documentation button
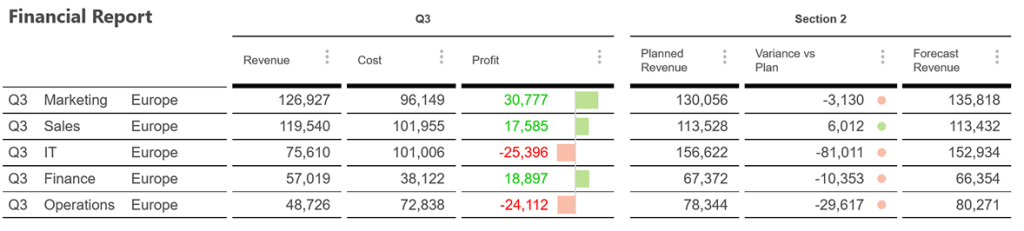
Microcharts
Maximize data density with high-impact, in-cell visualizations. Turn static tables into dynamic dashboards with integrated microcharts. The Smart Table allows you to embed bar charts and deviation indicators (absolute and relative) directly into your rows. These compact visualizations provide immediate context, allowing users to spot trends, outliers, and performance gaps at a glance without ever leaving the table view.
Documentation button
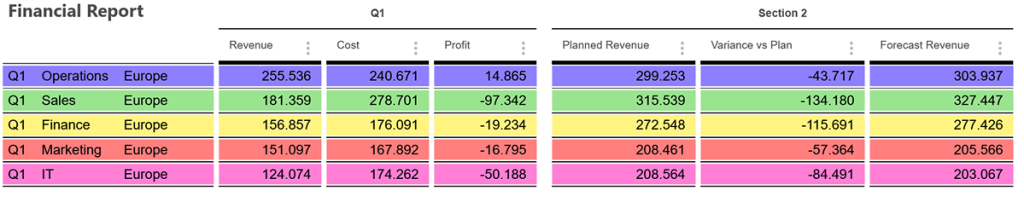
Custom Colors
Tailor your reports to your brand and your data. Break free from rigid defaults with a comprehensive color management system. Use curated palettes to align with your corporate identity, or implement data-driven coloring to highlight critical performance thresholds. From signal colors that flag risks to custom row backgrounds that organize complex hierarchies, you have total control over the visual narrative of your data.
Documentation button
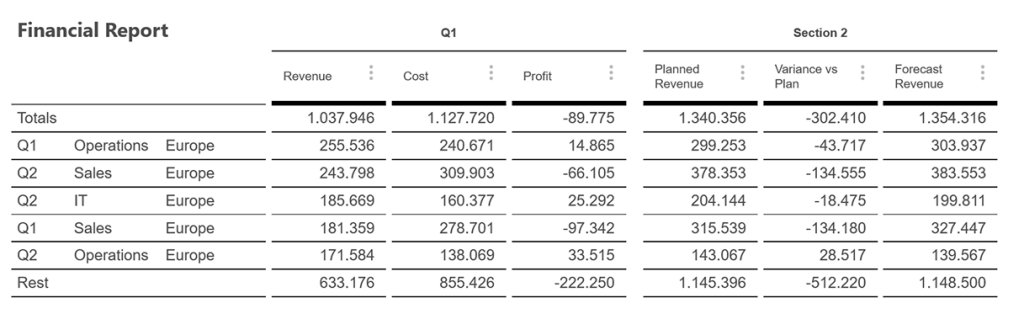
Pixel Perfect
Achieve professional-grade reporting with surgical precision. Designed for high-stakes corporate reporting, our “Pixel Perfect” rendering engine ensures that every cell, line, and chart is aligned with absolute accuracy. This precision prevents visual clutter and ensures that your financial statements and management reports maintain a crisp, polished, and trustworthy appearance—no matter how complex the layout.
Documentation button
Documentation
The Dynamic Icon visual has an extensive online documentation covering all parts of the visual