Certification of our Power BI visuals ensures top-notch security, quality, and performance for our customers. Each visual undergoes rigorous Microsoft reviews for security, code quality, functionality, and compatibility, ensuring they are free from malicious code and perform seamlessly across all Power BI platforms, including web, desktop, and mobile. Certified visuals meet strict performance metrics, efficiently handling large data volumes without compromising overall performance. They also include accessibility features, ensuring usability for individuals with disabilities, and use only approved APIs for flawless integration. Additionally, strict measures prevent unauthorized data exfiltration, safeguarding sensitive information. By choosing our certified visuals, you benefit from secure, reliable, and regulation-compliant tools, enhancing your data analysis capabilities with confidence and peace of mind.
Dashboard
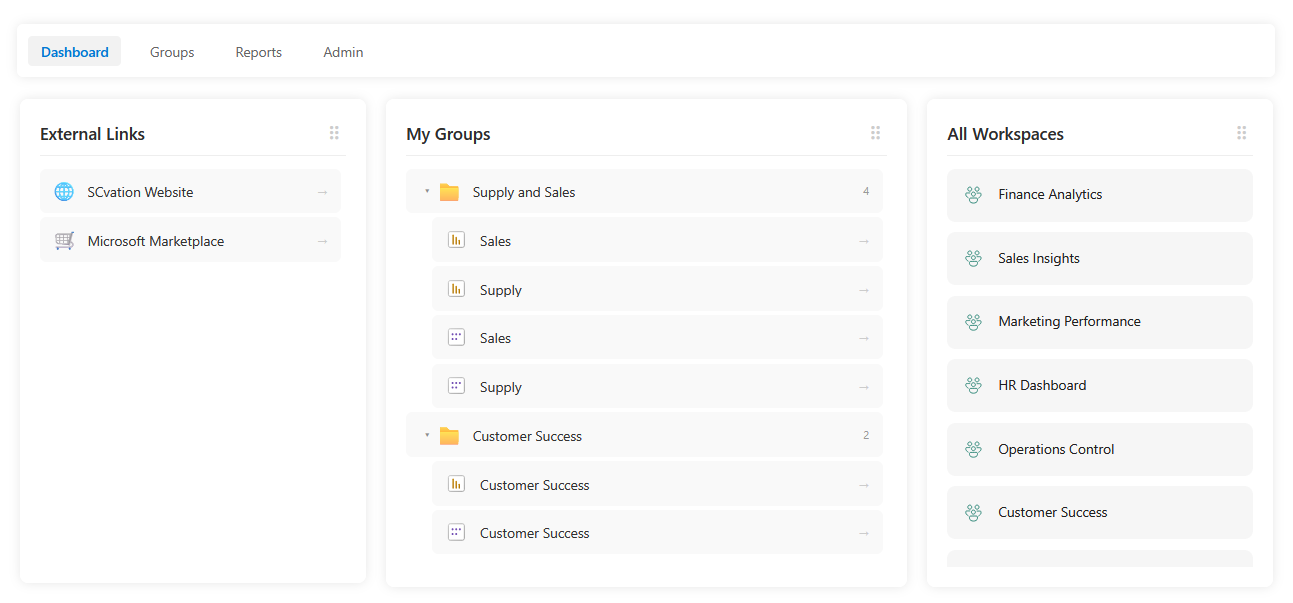
The Dashboard view serves as a customizable entry point for every user. It provides a high-level overview of the most relevant content through interactive “boxes” or widgets. Users can quickly access their personal Favorites, explore External Links (like company intranets or documentation), and see summaries of available Groups and Workspaces. For administrators, this view features a flexible drag-and-drop interface to tailor the layout and prioritize key resources.
Documentation button
Groups
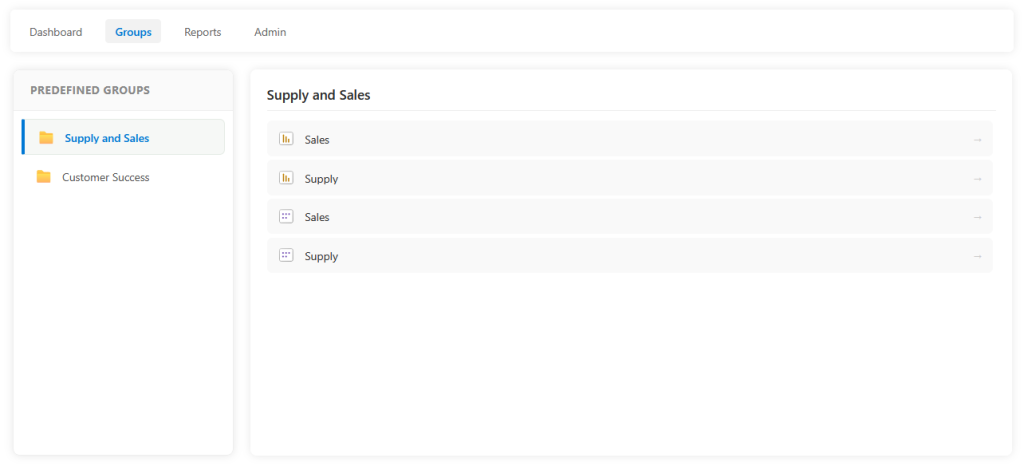
The Groups view organizes reports and dashboards into logical business categories, such as departments, projects, or specific functional areas. Instead of searching through hundreds of files, users can browse curated collections defined by administrators. This view simplifies the user journey by presenting related assets in a structured, easy-to-digest format, ensuring that the right data is always just a click away.
Documentation button
Reports
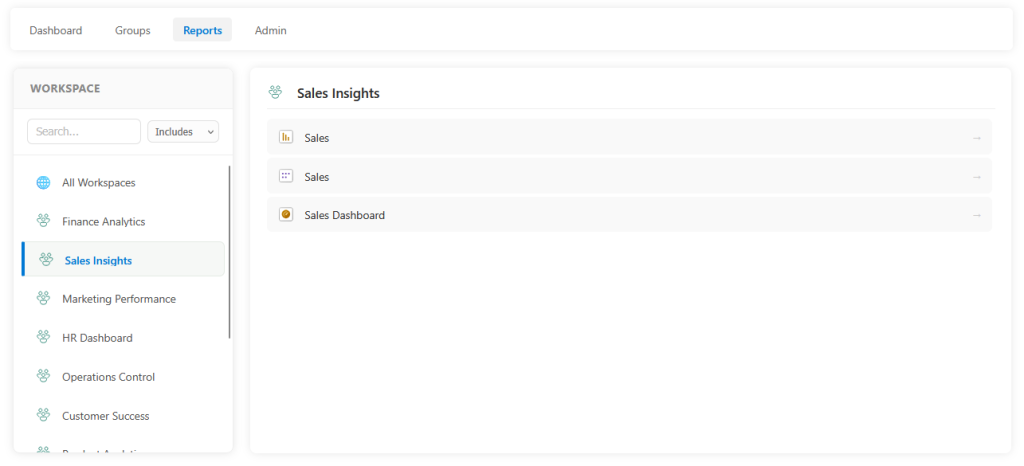
The Reports view offers a complete, explorer-style inventory of all Power BI assets you have access to. It mirrors the familiar hierarchical structure of Workspaces, allowing for deep-dive navigation across your entire organization. With built-in search and filtering capabilities, it acts as a central repository where users can locate any report, dashboard, or dataset within the Power BI ecosystem.
Documentation button
Admin
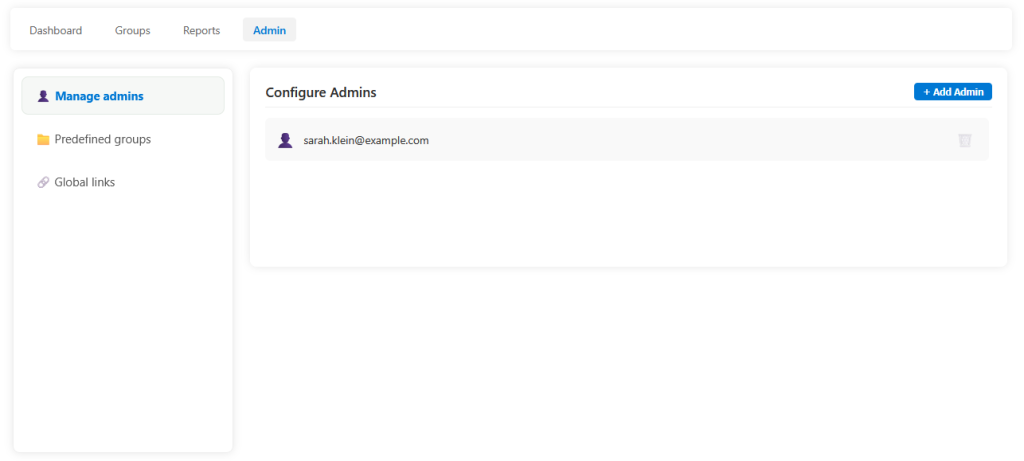
Exclusive to authorized users, the Admin View is where the Landing Page is configured and managed. It provides a suite of tools for administrators to:
Manage Permissions: Assign and revoke administrative rights.
Define Groups: Create and curate the predefined report groups seen in the Groups View.
Global Links: Set up external resources and documentation links that appear across the platform.
Layout Management: Oversee the global settings and default configurations for the visual.
Documentation button
Documentation
The Dynamic Icon visual has an extensive online documentation covering all parts of the visual